 Xin Wang
 Changchun Du
- Henan Provincial Chest Hospital, Zhengzhou, China
Objectives: To examine the associations of specific types of physical exercises, dietary preferences, and obesity patterns with incident hypertension.
Methods: In this cohort study, obesity patterns were defined using general and abdominal obesity as G-/A-, G+/A- or G-/A+, and G+/A+. The type of physical exercises and dietary preferences were collected using a validated questionnaire. Participants with systemic blood pressure/diastolic blood pressure ≥140 mmHg/90 mmHg, use of antihypertensive medications, or a self-reported diagnosis were identified as hypertension.
Results: There were 10,713 participants in this study. Martial arts, gymnastics, and ping pong could decrease the risk of hypertension (HR: 0.792, 0.884, and 0.855; and 95% CI: 0.743–0.845, 0.825–0.948, and 0.767–0.953, respectively). However, TV or computer usage, and consumption of fast food, soft/sugared drinks, and salty snack food could increase incident hypertension (HR: 1.418, 1.381, 1.233, and 1.225; and 95% CI: 1.315–1.529, 1.269–1.504, 1.157–1.314, and 1.139–1.316, respectively). Obese subjects had an increased risk of hypertension.
Conclusion: The type of physical exercises, dietary preferences, and obesity patterns were associated with incident hypertension. More attention should be paid to these lifestyles to benefit health outcomes.
Introduction
Hypertension plays a key role in the development of cardiovascular disease and cerebrovascular disease [1–3]. Therefore, hypertension has been an important public health concern worldwide. Recently, hypertensive individuals accounted for approximately 25% of the adult population, and this proportion is expected to be 29% by 2025 [4]. In China, the prevalence of hypertension has reached 23.2%, accounting for 244.5 million of the Chinese adult population [5]. Therefore, it is imperative to take active measurements to control and prevent hypertension.
It has been established that obesity, physical activity, and diet were strongly associated with the development of hypertension [6–10]. However, both general and abdominal obesity were considered as the main risk factors of hypertension. There might be an interaction between general and abdominal obesity. Therefore, obesity patterns defined by general and abdominal obesity might be more comprehensive in predicting the risk of hypertension. It is documented that physical exercise has multiple health benefits, especially for cardiovascular disease [11]. However, little is known about the associations of specific types of physical exercises with the incidence of hypertension. There were however some studies to investigate the relationship between dietary intakes and hypertension [12–14]. Given the complex climate and diversity of culture in China, dietary preferences varied across different provinces. Therefore, it was important to evaluate the associations of dietary preferences with the risk of hypertension on a national scale.
Therefore, this study was designed to explore the associations of specific types of physical exercises, dietary preferences, and obesity patterns with the incidence of hypertension. It was expected that this study would provide accurate evidence for the control and prevention of hypertension.
Methods
Study Design
Data analyzed in this study were obtained from the China Health and Nutrition Survey (CHNS), which was a 26-years national cohort study from 1989 to 2015 and covered nine provinces. A multistage random stratified cluster sampling method was used to select nine provinces from the 31 provinces of China to make the study representative across geography, economic development, and health indicators. Then, four counties were selected in each province using stratified random sampling by income. Villages or neighborhoods within those four counties were sampled randomly. Participants might enter into the CHNS in different waves. The main study population remained fixed between waves 1989 and 1993. Since the wave of 1997, a few new households were added to the survey to replace lost-to-follow-up participants. Meanwhile, an additional province of Heilongjiang was added. Since wave 2011, three megacities of Beijing, Chongqing, and Shanghai were added. In the CHNS, information on household survey, health and nutrition survey, physical activity, aging , body image, mass media behaviors and practices, marraige status, community survey, food market survey, and health and family planning facility surveys were collected. Especially, individual data on demographics, health-related behaviors, health history, dietary intake, blood pressure, and body composition were collected using a validated questionnaire. The details of analysis goals, survey design, and data collection in the CHNS were found in the literature published elsewhere [15].
Study Population
All subjects entering into the CHNS before wave 2015 and aged 18 years or over at baseline were the targeted population. Participants with any of the following items would be excluded: i. hypertension at baseline, ii. missing data, and iii. implausible outlying data (e.g., a weight >300 kg or <20 kg, a waist circumference (WC) > 200 cm or <20 cm).
Exposure Variables
Obesity patterns were defined using general and abdominal obesity, which were calculated using body mass index (BMI) and WC, respectively. BMI was calculated as weight in kilograms divided by height squared in meters, both of which were measured according to the standardized protocol. Participants with a BMI ≥28 kg/m2 were considered to have general obesity [16]. Otherwise, participants with a BMI <28 kg/m2 were identified as normal weight or overweight. Similarly, males with a WC ≥ 85 cm or females with a WC ≥ 80 cm were considered to have abdominal obesity [16]. Obesity patterns were defined as follows: G-/A- indicated participants without neither general obesity nor abdominal obesity, G+/A- or G-/A+ indicated participants with either general obesity or abdominal obesity, and G+/A+ indicated participants with both general and abdominal obesity.
The type of physical exercises in this study included martial arts, track and field, gymnastics, ping pong, badminton or volleyball, and soccer or basketball. Martial arts included Kung Fu and Tai Chi. Track and field included walking and running. And gymnastics included dancing and acrobatics. Additionally, sedentary behavior included TV or computer usage and reading or writing. Each type of physical exercise was collected using a validated questionnaire via a similar question: Do you participate in this activity? 0 indicates no, 1 indicates yes, and 9 indicates unknown [17]. In the final analysis, the option of “unknown” was removed. Since physical exercise types involved in the CHNS were limited to only those mentioned above, other physical exercises, such as cycling and swimming, were not analyzed in this study.
Similarly, each participant was asked their dietary preferences using a similar question: How much do you like this food? [18] The options included five items, which ranked in order from 1 indicating dislike very much to 5 indicating like very much. If participants did not eat this food, the number of 9 was assigned. Dietary preferences were dichotomized as follows: “dislike” included options 1, 2, and 9, and “like” included options 3, 4, and 5.
The Definition of Hypertension
The first wave of the CHNS was conducted in 1989, and the subsequent follow-up waves were conducted in 1991, 1993, 1997, 2000, 2004, 2006, 2009, 2011, and 2015, respectively. Since participants were not all recruited in 1989, the follow-up times of all participants were different. When participants entered into the CHNS, they were interviewed for blood pressure in each wave. If participants were firstly diagnosed with hypertension in a wave, the exact time when firstly diagnosed with hypertension was further checked. Each participant was required to rest for 10 min in the seated position before measurement of blood pressure. Suitable cuff sizes were chosen according to the upper arm circumference. A standard mercury sphygmomanometer was used to measure diastolic blood pressure (DBP) and systemic blood pressure (SBP), which were indicated by the first and fifth Korotkoff sounds, respectively [19]. These measurements were repeated three times, and the averages were used in the final analysis. If participants with an SBP ≥ 140 mmHg or/and a DBP ≥ 90 mmHg, use of antihypertensive medications, or a self-reported diagnosis with hypertension, they were identified as having hypertension [19].
Statistical Analysis
Continuous variables, such as age, BMI, and WC, were normal distribution. Therefore, means and standard deviations were employed to describe their distributions. Frequencies and constituent ratios were used to express categorical variables. Phi coefficient was used to assess the correlations across physical exercise types and food preferences. To correct the competitive risk of death, Cox regression with Fine-Gray competing risk model was employed to obtain hazard ratios (HRs) and 95% confidence intervals (CIs) on the associations of specific type of physical exercises, dietary preferences, and obesity patterns with the incidence of hypertension. New-onset hypertension was considered an end-event. Age-scale from birth year to the occurrence of hypertension, death, loss to follow-up, or the end of this study, whichever came first, was considered as the time variable. The proportional hazards assumption was confirmed to hold in all Cox regressions, and Cox regression was further stratified by living area. Furthermore, the interactions between sex and exposure variables on the incidence of hypertension were examined. All analyses were conducted using SAS 9.4 (SAS Institute Inc., Cary, NC, United States). A two-tailed p ≤ 0.05 indicated the statistical significance.
Results
The Baseline Characteristics
There were 10,713 participants included in the final analysis. The number of subjects with hypertension was 4,346, accounting for 40.57%. The proportions of men and women were 43.57 and 56.43%, respectively. The average age was 44.40 ± 15.42 years, and the averages of BMI and WC were 23.41 ± 3.66 kg/m2 and 81.54 ± 10.85 cm, respectively. (Table 1).
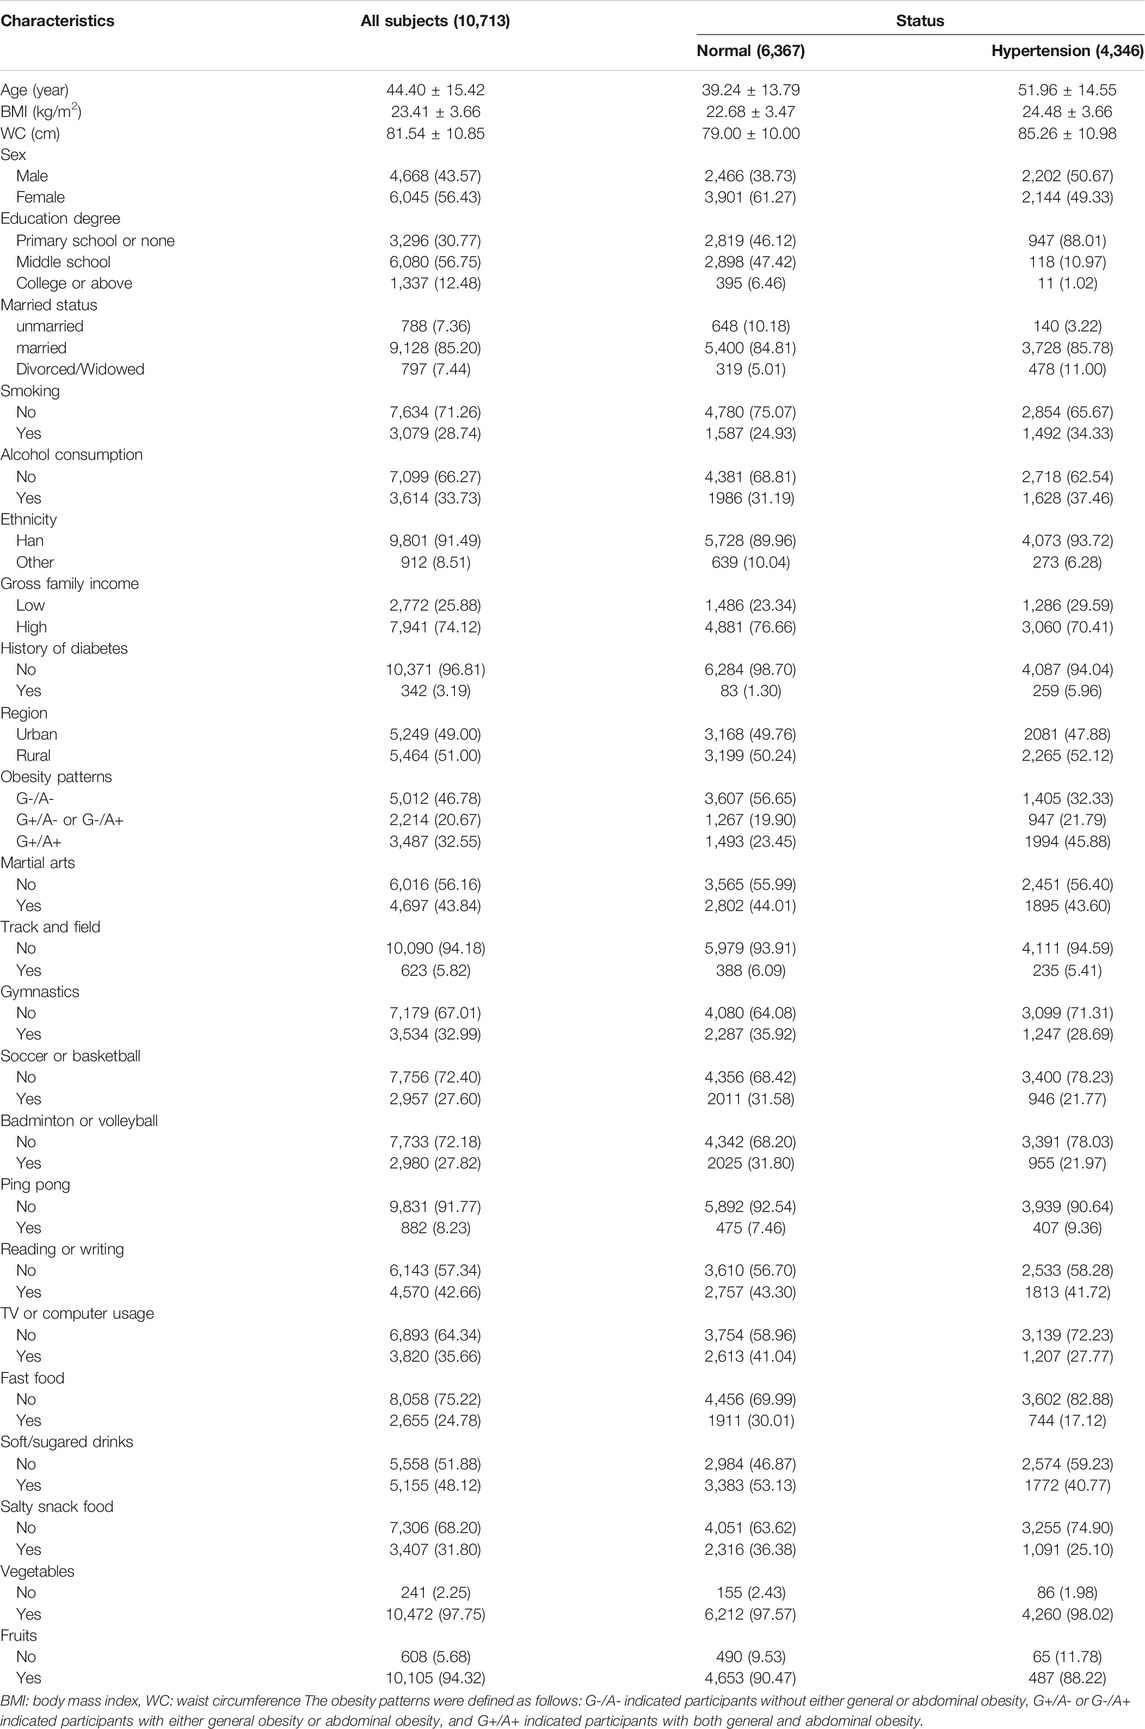
TABLE 1. The characteristics of all subjects at baseline. (Specific Types of Physical Exercises, Dietary Preferences, and Obesity Patterns With the Incidence of Hypertension: A 26-years Cohort Study, China, and 2021).
Correlations across physical exercise types or food preferences were performed. Supplementary Table S1 shows that there were strong correlations between martial arts and gymnastics (Phi = 0.543), between gymnastics and soccer or basketball (Phi = 0.662), and between gymnastics and badminton or volleyball (Phi = 0.658). And there was a very strong correlation between soccer or basketball and badminton or volleyball (Phi = 0.982). Supplementary Table S2 shows that a strong correlation was observed only between fast food and salty snack food (Phi = 0.583).
The Interactions Between Sex and Exposure Variables on the Incidence of Hypertension
Table 2 shows that there were significant interactions between sex and soccer or basketball, badminton or volleyball, TV or computer usage, fast food, soft/sugared drinks, salty snack food, and vegetables (HR: 0.848, 0.857, 0.716, 0.756, 0.841, 0.822, and 1.847; 95% CI: 0.701–0.996, 0.710–1.004, 0.572–0.859, 0.586–0.925, 0.715–0.966, 0.677–0.966, and 1.384–2.309; p = 0.029, 0.039, <0.001, 0.001, 0.007, 0.008, and 0.009, respectively).
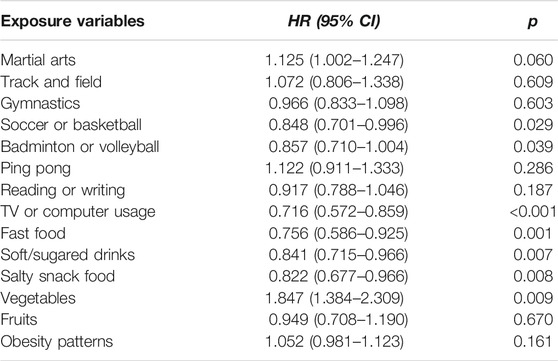
TABLE 2. The interactions between sex and exposure variables on the incidence of hypertension. (Specific Types of Physical Exercises, Dietary Preferences, and Obesity Patterns With the Incidence of Hypertension: A 26-years Cohort Study, China, and 2021).
The Associations of Specific Types of Physical Exercises With the Incidence of Hypertension
Table 3 shows the associations of each specific type of physical exercise with the incidence of hypertension. In total population, martial arts, gymnastics, and ping pong were associated with a lower risk of hypertension (HR: 0.792, 0.884, and 0.855; and 95% CI: 0.743–0.845, 0.825–0.948, and 0.767–0.953; and p < 0.001, = 0.001, and 0.005, respectively). However, TV or computer usage was associated with a higher risk of hypertension (HR: 1.418; and 95% CI: 1.315–1.529, p < 0.001). There were no significant associations of track and field, soccer or basketball, badminton or volleyball, and reading or writing with hypertension. The results of urban areas were in line with those in the total population. However, significant associations were observed in martial arts (p < 0.001), track and field (p = 0.041), gymnastics (p = 0.039), and TV or computer usage (p < 0.001) in rural areas. The Kaplan-Meier curves of specific type of physical exercise with the incidence of hypertension are shown in Supplementary Figure S1. And the full adjustment model of the associations of the specific types of physical exercise with the incidence of hypertension is displayed in Supplementary Table S3.
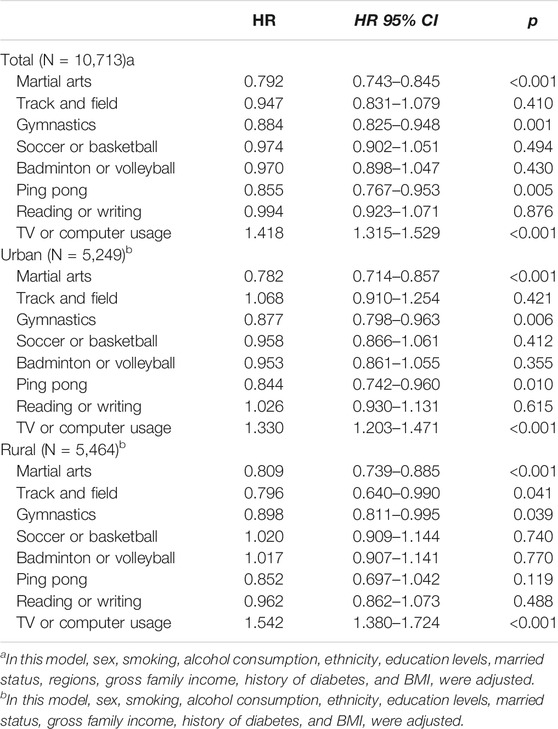
TABLE 3. The associations of specific types of physical exercise with the incidence of hypertension. (Specific Types of Physical Exercises, Dietary Preferences, and Obesity Patterns With the Incidence of Hypertension: A 26-years Cohort Study, China, and 2021).
The Associations of Dietary Preferences With the Incidence of Hypertension
The associations of dietary preferences with the risk of hypertension are displayed in Table 4. Subjects with dietary preferences of fast food, soft/sugared drinks, salty snack food, and fruit had a higher incidence of hypertension (HR: 1.381, 1.233, 1.225, and 1.155; and 95% CI: 1.269–1.504, 1.157–1.314, 1.139–1.316, and 1.021–1.307, respectively). However, a dietary preference for vegetables was not associated with the development of hypertension (p = 0.127). When stratified by region, the results were comparable with those in the total population, except for preference for fruits in rural areas (p = 0.260). The Kaplan-Meier curves of dietary preferences with the incidence of hypertension are shown in Supplementary Figure S2. The full adjustment model of the associations of dietary preferences with the incidence of hypertension is displayed in Supplementary Table S4.
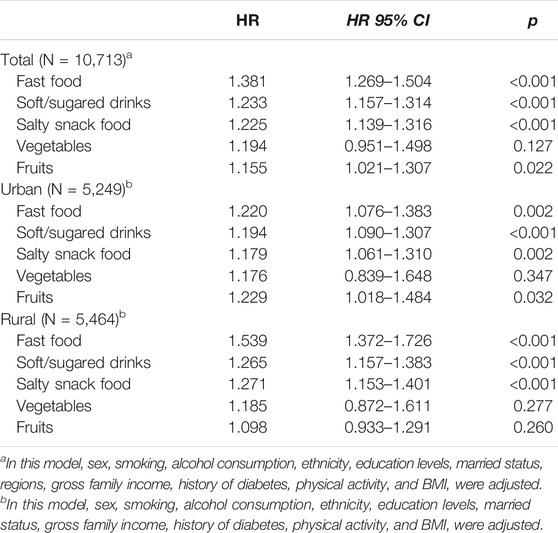
TABLE 4. The associations of dietary preferences with the incidence of hypertension. (Specific Types of Physical Exercises, Dietary Preferences, and Obesity Patterns With the Incidence of Hypertension: A 26-years Cohort Study, China, and 2021).
The Associations of Obesity Patterns With the Incidence of Hypertension
Compared to G-/A-, G+/A- or G-/A+, and G+/A+ could increase the incidence of hypertension. Furthermore, the effect of G+/A+ on hypertension was stronger than G+/A- or G-/A+ (HR: 1.803 vs 1.290; and 95% CI: 1.624–2.003 vs. 1.141–1.459) in the total population, as shown in Table 5. In both rural and urban areas, G+/A- or G-/A+ and G+/A+ were associated with a higher risk of hypertension. Similarly, subjects with G+/A+ had a higher risk of hypertension than those with G+/A- or G-/A+. The Kaplan-Meier curve of obesity patterns with the incidence of hypertension is shown in Supplementary Figure S2. On the other hand, when obesity patterns were divided into four categories, G+/A-, G-/A+, and G+/A+ were linked to a higher incidence of hypertension (HR: 1.505, 1.100, and 1.768; and 95% CI: 1.306–1.734, 1.001–1.208, and 1.646–1.898, respectively) compared to G-/A-. And the full adjustment model of the associations of obesity patterns with the incidence of hypertension is displayed in Supplementary Table S4.
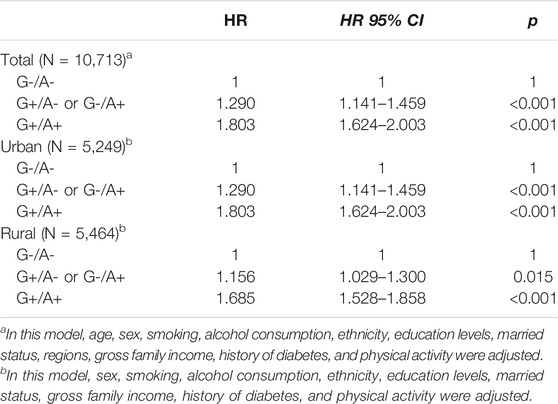
TABLE 5. The associations of obesity patterns with the incidence of hypertension. (Specific Types of Physical Exercises, Dietary Preferences, and Obesity Patterns With the Incidence of Hypertension: A 26-years Cohort Study, China, and 2021).
The Contributions of all Exposure Variables to the Incidence of Hypertension
Supplementary Table S5 shows that TV or computer usage mostly contributed to the incidence of hypertension (HR: 1.411; 95% CI: 1.307–1.524; and p < 0.001) when all physical exercise types were analyzed simultaneously. When dietary preferences were analyzed simultaneously, fast food was the most promising predictor of incident hypertension (HR: 1.263; 95% CI: 1.140–1.398; and p < 0.001). When physical exercise types, dietary preferences, and obesity patterns were analyzed simultaneously, an obesity pattern of G+/A+ was the most promising predictor of incident hypertension (HR: 1.845; 95% CI: 1.715–1.985; and p < 0.001).
Discussion
This study was conducted to examine the associations of specific types of physical exercise, dietary preferences, and obesity patterns with the incidence of hypertension in the Chinese adult population. The results implied that martial arts, gymnastics, and ping pong were associated with a lower risk of hypertension. However, dietary preferences for fast food, soft/sugared drinks, and salty snack food, as well as TV or computer usage increased the risk of hypertension. Furthermore, compared to subjects with G-/A-, subjects with G+/A- or G-/A+ or G+/A+ had an increased risk of hypertension. Furthermore, an obesity pattern of G+/A+ was the most promising predictor of incident hypertension.
Physical exercise is essential to reduce blood pressure and is broadly recommended to control and treat hypertension by the current American and European hypertension guidelines [19–21]. However, little was known on the associations of specific types of physical exercise with the risk of hypertension. A previous study reported that subjects participating in swimming, basketball, and aerobics had decreased all-cause and cardiovascular mortality [22]. In this study, subjects preferring martial arts, gymnastics, and ping pong had a lower risk of hypertension, which was consistent with previous studies [23, 24]. It was suggested that physical exercise could improve the redox state and functional and biochemical properties of the cardiovascular system [25, 26]. Furthermore, physical exercise could modulate superoxide dismutase activity and improve endothelial function via inhibiting oxidative stress and inflammatory markers [27, 28]. As is well known, regular physical exercise improves energy metabolism and reduces adiposity, which is positively associated with hypertension [29]. Therefore, physical exercise was considered beneficial for hypertension and cardiovascular disease.
In this study, TV or computer usage was associated with a higher risk of hypertension, which was consistent with previous studies [30, 31]. TV or computer usage, as sedentary behavior, was associated with consumption of unhealthy foods, overeating, tobacco smoking, and physical inactivity [32–34]. These risk factors linked TV or computer usage to the risk of hypertension. Furthermore, TV or computer usage could reduce muscle contraction and increase vascular inflammation, which would elevate blood pressure [35, 36].
Subjects preferring fast food, soft/sugared drinks, and salty snack food had a higher risk of hypertension in this study. Fast food was a feature of western dietary patterns and related to a higher risk of hypertension, which was consistent with the findings of this study [37]. In recent decades, fast-food consumption has been growing rapidly in China [38]. As is well known, fast food is rich in unhealthy fats, salt, and sugar, which promoted the development of obesity and hypertension [39]. Therefore, it was feasible that fast food preference was associated with a higher risk of hypertension. On the other hand, soft/sugared drinks were linked to an increase in serum triglycerides levels, caloric intake, and insulin resistance, which are strongly associated with obesity and hypertension [40, 41]. However, dietary preference for vegetables was not associated with the development of hypertension in this study. The possible reasons were as follows: Firstly, the proportion of subjects preferring vegetables was very high in both normal and hypertensive subjects. Thus, the protective effect of vegetables might be masked. Secondly, this study focused on the dietary habit of vegetable consumption rather than on the specific types of vegetables. Therefore, vegetables unrelated to hypertension might confuse the actual effect on hypertension of vegetables as a whole.
Obesity patterns were used to establish how the co-existence of general and abdominal obesity affected the risk of hypertension. The results suggested that subjects with at least one of general or abdominal obesity had an increased incidence of hypertension. Furthermore, subjects with both general and abdominal obesity had a higher risk of hypertension than those with only one of general and abdominal obesity, which was similar to a previous study [42]. BMI and WC were considered as independent risk factors for hypertension and should be together used to predict hypertension. Therefore, the findings of this study provided further evidence on the co-associations of general and abdominal obesity with the risk of hypertension.
This study found that there were significant interactions between sex and physical exercise and dietary preferences on hypertension. A previous study reported that men were more likely to develop hypertension than women among young adults [43, 44]. Furthermore, it was documented that sex affected motivation toward physical exercise and modified the association of physical exercises with health outcomes [45, 46]. On the other hand, compared to men, women were more likely to consume vegetables but less likely to consume soft drinks [47]. Therefore, that mentioned above supports the finding of this study.
Strengths and Limitations
This study has the advantage of a large-scale representative sample of the Chinese population. Therefore, the results of this study were convictive. The population in this study included a geographically diverse population, which made the results generalizable to the greater Chinese population. Furthermore, the associations of obesity patterns and specific types of physical exercise with the risk of hypertension were rarely investigated, especially in the Chinese population. Therefore, this study was expected to provide additional evidence and insights for the prevention of hypertension. However, there were also some limitations in this study. Firstly, since the salt intake of participants in the CHNS was unavailable, the dietary-related information failed to be adjusted. Secondly, the population analyzed in this study is limited to the ethnically Chinese. Researchers should be cautious in extrapolating the conclusion to other ethnicities. Thirdly, the data on physical exercise and dietary preferences were collected using a self-reported questionnaire. There might be measurement bias. Fourthly, since dietary intakes were not available in the CHNS, dietary preferences but not dietary intake were used to evaluate the association of diet with the risk of hypertension.
Conclusion
Martial arts, gymnastics, and ping pong were associated with a lower risk of hypertension. Dietary preferences of fast food, soft/sugared drinks, and salty snack food, as well as TV or computer usage, increased the risk of hypertension. Obese subjects were more likely to develop hypertension. Furthermore, the obesity pattern of both general and abdominal obesity was the most promising predictor of incident hypertension. The findings of this study have important public health implications regarding unhealthy dietary preferences and which type of physical exercise benefited cardiovascular health.
Data Availability Statement
The datasets analyzed during the current study are available on the CHNS website: http://www.cpc.unc.edu/projects/china.
Ethics Statement
The studies involving human participants were reviewed and approved by the IRB of the National Institute for Nutrition and Food Safety, China Center for Disease Control and Prevention, and University of North Carolina at Chapel Hill. The patients/participants provided their written informed consent to participate in this study.
Author Contributions
All authors contributed to the study conception and design. Material preparation, data collection and analysis were performed by FZ, QZ, KW, SK, PM, and BH. The first draft of the manuscript was written by XW and CD, and all authors commented on previous versions of the manuscript. All authors read and approved the final manuscript.
Conflict of Interest
The authors declare that the research was conducted in the absence of any commercial or financial relationships that could be construed as a potential conflict of interest.
Acknowledgments
This research uses data from China Health and Nutrition Survey (CHNS). We thank the National Institute for Nutrition and Health, China Center for Disease Control and Prevention, Carolina Population Center, the University of North Carolina at Chapel Hill, the NIH, and the NIH Fogarty International Center for support for the CHNS data collection and analysis files from 1989 to 2015 and future surveys, and the China-Japan Friendship Hospital, Ministry of Health for support for CHNS 2009, Chinese National Human Genome Center at Shanghai since 2009, and Beijing Municipal Center for Disease Prevention and Control since 2011.
Supplementary Material
The Supplementary Material for this article can be found online at: https://www.ssph-journal.org/articles/10.3389/ijph.2021.1604441/full#supplementary-material
Supplementary Figure S1 | The Kaplan-Meier curves of specific types of physical exercise with the incidence of hypertension (Lifestyle, obesity, and hypertension, China, 2021). A: Martial arts, B: Track and field, C: Gymnastics, D: Soccer or basketball, E: Badminton or volleyball, F: Ping pong, G: Reading or writing, and H: TV or computer usage. The x-axis represented age-scale, which was calculated as the time from birth year to the occurrence of hypertension, death, loss to follow-up, or the end of this study, whichever came first.
Supplementary Figure S2 | The Kaplan-Meier curves of obesity patterns and dietary preferences with the incidence of hypertension (Lifestyle, obesity, and hypertension, China, 2021). A: Obesity patterns, B: Fast food, C: Soft/sugared drinks, D: Salty snack food, E: Vegetables, and F: Fruits. The x-axis represented age-scale, which was calculated as the time from birth year to the occurrence of hypertension, death, loss to follow-up, or the end of this study, whichever came first.
References
1.Whitworth JA, World Health Organization ISoHWG. 2003 2003 World Health Organization (WHO)/International Society of Hypertension (ISH) Statement on Management of Hypertension. J Hypertens. 21(11):1983–92.doi:10.1097/00004872-200311000-00002
2. O'Donnell, MJ, Chin, SL, Rangarajan, S, Xavier, D, Liu, L, Zhang, H, et al. Global and Regional Effects of Potentially Modifiable Risk Factors Associated with Acute Stroke in 32 Countries (INTERSTROKE): a Case-Control Study. The Lancet. 2016;388(10046):761–75.doi:10.1016/s0140-6736(16)30506-2
3. Blacher, J, Levy, BI, Mourad, J-J, Safar, ME, and Bakris, G. From Epidemiological Transition to Modern Cardiovascular Epidemiology: Hypertension in the 21st century. The Lancet. 2016;388(10043):530–2.doi:10.1016/s0140-6736(16)00002-7
4. Ruan, Y, Huang, Y, Zhang, Q, Qin, S, Du, X, and Sun, Y. Association between Dietary Patterns and Hypertension Among Han and Multi-Ethnic Population in Southwest China. BMC public health. 2018;18(1):1106.doi:10.1186/s12889-018-6003-7
5. Wang, Z, Chen, Z, Zhang, L, Wang, X, Hao, G, Zhang, Z, et al. Status of Hypertension in China. Circulation. 2018;137(22):2344–56.doi:10.1161/circulationaha.117.032380
6. Chen, Y, Liang, X, Zheng, S, Wang, Y, and Lu, W. Association of Body Fat Mass and Fat Distribution with the Incidence of Hypertension in a Population-Based Chinese Cohort: A 22-Year Follow-Up. J Am Heart Assoc. 2018;7(6):e007153.doi:10.1161/JAHA.117.007153
7. Chandra, A, Neeland, IJ, Berry, JD, Ayers, CR, Rohatgi, A, Das, SR, et al. The Relationship of Body Mass and Fat Distribution with Incident Hypertension. J Am Coll Cardiol. 2014;64(10):997–1002.doi:10.1016/j.jacc.2014.05.057
8. Wang, D, He, Y, Li, Y, Luan, D, Yang, X, Zhai, F, et al. Dietary Patterns and Hypertension Among Chinese Adults: a Nationally Representative Cross-Sectional Study. BMC public health. 2011;11:925.doi:10.1186/1471-2458-11-925
9. Dimeo, F, Pagonas, N, Seibert, F, Arndt, R, Zidek, W, and Westhoff, TH. Aerobic Exercise Reduces Blood Pressure in Resistant Hypertension. Hypertension. 2012;60(3):653–8.doi:10.1161/hypertensionaha.112.197780
10. Liu, X, Zhang, D, Liu, Y, Sun, X, Han, C, Wang, B, et al. Dose-Response Association between Physical Activity and Incident Hypertension. Hypertension. 2017;69(5):813–20.doi:10.1161/hypertensionaha.116.08994
11. Lee, I-M, Shiroma, EJ, Lobelo, F, Puska, P, Blair, SN, Katzmarzyk, PT, et al. Effect of Physical Inactivity on Major Non-communicable Diseases Worldwide: an Analysis of burden of Disease and Life Expectancy. The Lancet. 2012;380(9838):219–29.doi:10.1016/s0140-6736(12)61031-9
12. Lancaster, KJ, Smiciklas-Wright, H, Weitzel, LB, Mitchell, DC, Friedmann, JM, and Jensen, GL. Hypertension-related Dietary Patterns of Rural Older Adults. Prev Med. 2004;38(6):812–8.doi:10.1016/j.ypmed.2004.01.002
13. Appel, LJ, Brands, MW, Daniels, SR, Karanja, N, Elmer, PJ, Sacks, FM, et al. Dietary Approaches to Prevent and Treat Hypertension. Hypertension. 2006;47(2):296–308.doi:10.1161/01.hyp.0000202568.01167.b6
14. Schulze, MB, and Hu, FB. Dietary Patterns and Risk of Hypertension, Type 2 Diabetes Mellitus, and Coronary Heart Disease. Curr Atheroscler Rep. 2002;4(6):462–7.doi:10.1007/s11883-002-0051-1
15. Popkin, BM, Du, S, Zhai, F, and Zhang, B. Cohort Profile: The China Health and Nutrition Survey-Mmonitoring and Understanding Socio-Economic and Health Change in China, 1989-2011. Int J Epidemiol. 2010;39(6):1435–40.doi:10.1093/ije/dyp322
16. Xi, B, Liang, Y, He, T, Reilly, KH, Hu, Y, Wang, Q, et al. Secular Trends in the Prevalence of General and Abdominal Obesity Among Chinese Adults, 1993-2009. Obes Rev. 2012;13(3):287–96.doi:10.1111/j.1467-789x.2011.00944.x
17. Zuo, H, Shi, Z, Yuan, B, Dai, Y, Hu, G, Wu, G, et al. Interaction between Physical Activity and Sleep Duration in Relation to Insulin Resistance Among Non-diabetic Chinese Adults. BMC public health. 2012;12:247.doi:10.1186/1471-2458-12-247
18. Pan, X-B, Wang, H-J, Zhang, B, Liu, Y-L, Qi, S-F, and Tian, Q-B. Plain Water Intake and Association with the Risk of Overweight in the Chinese Adult Population: China Health and Nutrition Survey 2006-2011. J Epidemiol. 2020;30(3):128–35.doi:10.2188/jea.je20180223
19. Chobanian, AV, Bakris, GL, Black, HR, Cushman, WC, Green, LA, Izzo, JL, et al. The Seventh Report of the Joint National Committee on Prevention, Detection, Evaluation, and Treatment of High Blood PressureThe JNC 7 Report. Jama. 2003;289(19):2560–72.doi:10.1001/jama.289.19.2560
20. Mancia, G, De Backer, G, Dominiczak, A, Cifkova, R, Fagard, R, Germano, G, et al. 2007 2007 Guidelines for the Management of Arterial Hypertension. J Hypertens. 2007;25(6):1105–87.doi:10.1097/hjh.0b013e3281fc975a
21. Hamer, M, Lavoie, KL, and Bacon, SL. Taking up Physical Activity in Later Life and Healthy Ageing: the English Longitudinal Study of Ageing. Br J Sports Med. 2014;48(3):239–43.doi:10.1136/bjsports-2013-092993
22. Oja, P, Kelly, P, Pedisic, Z, Titze, S, Bauman, A, Foster, C, et al. Associations of Specific Types of Sports and Exercise with All-Cause and Cardiovascular-Disease Mortality: a Cohort Study of 80 306 British Adults. Br J Sports Med. 2017;51(10):812–7.doi:10.1136/bjsports-2016-096822
23. Jia, X, Yu, Y, Xia, W, Masri, S, Sami, M, Hu, Z, et al. Cardiovascular Diseases in Middle Aged and Older Adults in China: the Joint Effects and Mediation of Different Types of Physical Exercise and Neighborhood Greenness and Walkability. Environ Res. 2018;167:175–83.doi:10.1016/j.envres.2018.07.003
24. Yu, Y, Gao, Q, Xia, W, Zhang, L, Hu, Z, Wu, X, et al. Association between Physical Exercise and Biomarkers of Oxidative Stress Among Middle-Aged and Elderly Community Residents with Essential Hypertension in China. Biomed Res Int. 2018;2018:4135104.doi:10.1155/2018/4135104
25. Cornelissen, VA, and Smart, NA. Exercise Training for Blood Pressure: a Systematic Review and Meta-Analysis. J Am Heart Assoc. 2013;2(1):e004473.doi:10.1161/JAHA.112.004473
26. Sharman, JE, La Gerche, A, and Coombes, JS. Exercise and Cardiovascular Risk in Patients with Hypertension. Am J Hypertens. 2015;28(2):147–58.doi:10.1093/ajh/hpu191
27. Halliwill, JR, Buck, TM, Lacewell, AN, and Romero, SA. Postexercise Hypotension and Sustained Postexercise Vasodilatation: what Happens after We Exercise? Exp Physiol. 2013;98(1):7–18.doi:10.1113/expphysiol.2011.058065
28. Rodrigues-Krause, J, Farinha, JB, Krause, M, and Reischak-Oliveira, Á. Effects of Dance Interventions on Cardiovascular Risk with Ageing: Systematic Review and Meta-Analysis. Complement therapies Med. 2016;29:16–28.doi:10.1016/j.ctim.2016.09.004
29. Mozaffarian, D, Hao, T, Rimm, EB, Willett, WC, and Hu, FB. Changes in Diet and Lifestyle and Long-Term Weight Gain in Women and Men. N Engl J Med. 2011;364(25):2392–404.doi:10.1056/nejmoa1014296
30. Werneck, AO, Cyrino, ES, Collings, PJ, Ronque, ERV, Szwarcwald, CL, Sardinha, LB, et al. TV Viewing in 60,202 Adults from the National Brazilian Health Survey: Prevalence, Correlates, and Associations with Chronic Diseases. J Phys Act Health. 2018;15(7):510–5.doi:10.1123/jpah.2017-0317
31. Shiue, I. Duration of Daily TV/screen Watching with Cardiovascular, Respiratory, Mental and Psychiatric Health: Scottish Health Survey, 2012-2013. Int J Cardiol. 2015;186:241–6.doi:10.1016/j.ijcard.2015.03.259
32. Mielke, GI, da Silva, ICM, Owen, N, and Hallal, PC. Brazilian Adults' Sedentary Behaviors by Life Domain: Population-Based Study. PloS one. 2014;9(3):e91614.doi:10.1371/journal.pone.0091614
33. Matthews, CE, George, SM, Moore, SC, Bowles, HR, Blair, A, Park, Y, et al. Amount of Time Spent in Sedentary Behaviors and Cause-specific Mortality in US Adults. Am J Clin Nutr. 2012;95(2):437–45.doi:10.3945/ajcn.111.019620
34. Touvier, M, Bertrais, S, Charreire, H, Vergnaud, A-C, Hercberg, S, and Oppert, J-M. Changes in Leisure-Time Physical Activity and Sedentary Behaviour at Retirement: a Prospective Study in Middle-Aged French Subjects. Int J Behav Nutr Phys Act. 2010;7:14.doi:10.1186/1479-5868-7-14
35. Hamilton, MT, Hamilton, DG, and Zderic, TW. Role of Low Energy Expenditure and Sitting in Obesity, Metabolic Syndrome, Type 2 Diabetes, and Cardiovascular Disease. Diabetes. 2007;56(11):2655–67.doi:10.2337/db07-0882
36. Hamburg, NM, McMackin, CJ, Huang, AL, Shenouda, SM, Widlansky, ME, Schulz, E, et al. Physical Inactivity Rapidly Induces Insulin Resistance and Microvascular Dysfunction in Healthy Volunteers. Atvb. 2007;27(12):2650–6.doi:10.1161/atvbaha.107.153288
37. Sun, J, Buys, N, and Hills, A. Dietary Pattern and its Association with the Prevalence of Obesity, Hypertension and Other Cardiovascular Risk Factors Among Chinese Older Adults. Ijerph. 2014;11(4):3956–71.doi:10.3390/ijerph110403956
38. Wang, Y, Wang, L, Xue, H, and Qu, W. A Review of the Growth of the Fast Food Industry in China and its Potential Impact on Obesity. Int J Environ Res Public Health. 2016;13(11).doi:10.3390/ijerph13111112
39. Pan, A, Malik, VS, and Hu, FB. Exporting Diabetes Mellitus to Asia. Circulation. 2012;126(2):163–5.doi:10.1161/circulationaha.112.115923
40. Troiano, RP, Briefel, RR, Carroll, MD, and Bialostosky, K. Energy and Fat Intakes of Children and Adolescents in the united states: Data from the National Health and Nutrition Examination Surveys. Am J Clin Nutr. 2000;72(5 Suppl. l):1343S–1353S.doi:10.1093/ajcn/72.5.1343s
41. Smith, JB, Niven, BE, and Mann, JI. The Effect of Reduced Extrinsic Sucrose Intake on Plasma Triglyceride Levels. Eur J Clin Nutr. 1996;50(8):498–504.
42. Meng, R, Lv, J, Yu, C, Guo, Y, Bian, Z, Yang, L, et al. Prenatal Famine Exposure, Adulthood Obesity Patterns and Risk of Type 2 Diabetes. Int J Epidemiol. 2018;47(2):399–408.doi:10.1093/ije/dyx228
43. Fryar, CD, Ostchega, Y, Hales, CM, Zhang, G, and Kruszon-Moran, D. Hypertension Prevalence and Control Among Adults: United States, 2015-2016. NCHS Data Brief. Hyattsville, MD: National Center for Health Statistics (2015–2017). (289):1–8.
44. Gerdts, E, and Regitz-Zagrosek, V. Sex Differences in Cardiometabolic Disorders. Nat Med. 2019;25(11):1657–66.doi:10.1038/s41591-019-0643-8
45. Kim, H, Jeong, W, Kwon, J, Kim, Y, Jang, S-I, and Park, E-C. Sex Differences in Type of Exercise Associated with Depression in South Korean Adults. Sci Rep. 2020;10(1):18271.doi:10.1038/s41598-020-75389-8
46. Navarro, J, Escobar, P, Miragall, M, Cebolla, A, and Baños, RM. Adolescent Motivation toward Physical Exercise: The Role of Sex, Age, Enjoyment, and Anxiety. Psychol Rep. 2021;124(3):1049–69.doi:10.1177/0033294120922490
Keywords: cohort study, obesity patterns, physical exercise, dietary preferences, incident hypertension
Citation: Wang X, Zhao F, Zhao Q, Wang K, Kong S, Ma P, Huang B and Du C (2022) Specific Types of Physical Exercises, Dietary Preferences, and Obesity Patterns With the Incidence of Hypertension: A 26-years Cohort Study. Int J Public Health 66:1604441. doi: 10.3389/ijph.2021.1604441
Received: 30 August 2021; Accepted: 13 December 2021;
Published: 27 January 2022.
Edited by:
Vittorio Krogh, National Cancer Institute Foundation (IRCCS), ItalyReviewed by:
Claudia Agnoli, National Cancer Institute Foundation (IRCCS), ItalyVittorio Simeon, Università della Campania Luigi Vanvitelli, Italy
Copyright © 2022 Wang, Zhao, Zhao, Wang, Kong, Ma, Huang and Du. This is an open-access article distributed under the terms of the Creative Commons Attribution License (CC BY 4.0). The use, distribution or reproduction in other forums is permitted, provided the original author(s) and the copyright owner(s) are credited and that the original publication in this journal is cited, in accordance with accepted academic practice. No use, distribution or reproduction is permitted which does not comply with these terms.
*Correspondence: Changchun Du, wx13525502495@163.com