 Di Zhu
 Dongnan Zhou
 Nana Li
 Bing Han
- Department of Biostatistics, School of Public Health, China Medical University, Shenyang, China
Objectives: To predict the number of people with diabetes and estimate the economic burden in China.
Methods: Data from natural logarithmic transformation of the number of people with diabetes in China from 2000 to 2018 were selected to fit the autoregressive integrated moving average (ARIMA) model, and 2019 data were used to test it. The bottom-up and human capital approaches were chosen to estimate the direct and indirect economic burden of diabetes respectively.
Results: The number of people with diabetes in China would increase in the future. The ARIMA model fitted and predicted well. The number of people with diabetes from 2020 to 2025 would be about 94, 96, 97, 98, 99 and 100 m respectively. The economic burden of diabetes from 2019 to 2025 would be about $156b, $160b, $163b, $165b, $167b, $169b and $170b respectively.
Conclusion: The situation of diabetes in China is serious. The ARIMA model can be used to predict the number of people with diabetes. We should allocate health resources in a rational manner to improve the prevention and control of diabetes.
Introduction
Diabetes is a chronic metabolic disease in which the body cannot use or produce enough insulin efficiently [1], mainly related to genetic and environmental factors. People with diabetes need to keep appropriate blood sugar levels through medication and diet, etc. Failure to control blood glucose effectively for a long time leads to various acute and chronic complications which eventually lead to disability or death, such as diabetic ketoacidosis, diabetic nephropathy, diabetic foot and so forth. Diabetes is one of the significant causes of death worldwide [2] and it imposes a substantial global burden [3]. From 2000 to 2019, the number of people with diabetes increased from 218 million to 460 million worldwide [4]. During the same time period, the number of people with diabetes increased from 48 million to 92 million in China, which made China the country with the highest number of people with diabetes in the world in 2019 [4]. Besides, it was estimated that the number of undiagnosed diabetes patients was about 65 million in China in 2019 [5]. Therefore, diabetes becomes an extremely serious public health challenge in the world and in China.
In 2019, the number of people aged 60 and over in China was approximately 254 million, which accounted for about 18.1% of the total population [6]. Since the prevalence of diabetes increases with age [7], such a large susceptible population inevitably leads to the increase in the number of people with diabetes. Therefore, it is particularly important to forecast the prevalence trends of diabetes in China.
ARIMA model is one of the analysis methods for time series. This model is based on an adjusted version of the observed values and its objective is to reduce the difference between the values generated in the model and the observed values to as close to zero as possible [8]. This model is widely used in the medical field. For example, with data on prostate cancer in Australia from 1982 to 2013, ARIMA model was used to predict the incidence of prostate cancer from 2014 to 2022 [9]. The ARIMA model was used to predict Alzheimer’s disease mortality in the United States from 2019 to 2023 [10]. In addition, ARIMA model has a wide range of applications in fields such as meteorology [11], economics [12] and agriculture [13].
The high prevalence of diabetes not only affects the health condition of people with diabetes seriously, but also causes a heavy economic burden of the disease on patients, their families, and society [14]. Economic burden of disease refers to the economic loss due to disease and its complications, including direct economic burden, indirect economic burden and intangible economic burden [15]. The direct economic burden of diabetes refers to the costs incurred during the treatment and rehabilitation of diabetes, mainly including outpatient costs, inpatient costs, and drug costs [16]. Indirect economic burden refers to the loss of productivity due to morbidity and premature mortality caused by diabetes [17]. According to the estimation of International Diabetes Federation, the global health expenditure of diabetes was approximately $760 billion in 2019, and the countries with the heaviest health expenditure of diabetes were: the United States at $295 billion, China at $109 billion, and Brazil at $52 billion [5]. Previous studies showed that the indirect economic burden of diabetes cost between 30 and 40% of the total economic burden in 2015 [3]. The economic burden of diabetes is increasing rapidly. If no effective measures are taken, diabetes will become one of the major challenging factors of the economic and social development.
In this study, the ARIMA model is used to fit the log-transformed annual number of people with diabetes in China from 2000 to 2018, select the number of people with diabetes in 2019 for model testing, and predict the future number of people with diabetes in China. The direct economic burden of diabetes and the indirect economic burden of diabetes are estimated using the bottom-up approach and the human capital approach respectively. The purpose of the research is to provide data support for diabetes prevention and control in China, and to establish a theoretical basis for relevant national departments to improve the diabetes-related health policy and rationalize the allocation of health resources.
Methods
Data
Data on the number of people with diabetes from 2000 to 2019 for each year and disability-adjusted life years (DALYs) were obtained from the Global Burden of Disease (GBD) (http://ghdx.healthdata.org/gbd-results-tool) (Supplemental Table S1). The Chinese gross national income (GNI) per capita in 2019 was obtained from the National Bureau of Statistics of China (http://www.stats.gov.cn/tjsj/sjjd/202008/t20200807_1781473.html). The conversion between USD and RMB was based on the exchange rate in 2019 published by National Bureau of Statistics of China. Data were analyzed using R4.1.0.
ARIMA Model
Model Introduction
The ARIMA (p, d, q) model (p is the autoregressive term which express the relationship between current and historical values, d is the number of differences, and q is the moving average term which is used to eliminate random fluctuations) in which AR stands for autoregressive, MA stands for moving average, and I stands for integrated [18]. The p-order AR process is:
If
In this formula:
ARIMA (p, d, q) can also be represented by the following function:
Modeling Process
We established a time series after natural logarithmic transformation of the number of people with diabetes in China from 2000 to 2018, and used ARIMA model to forecast the number of people with diabetes in China from 2019 to 2025. The modeling process was as follows: The first step was the unit root test. The ARIMA (p, d, q) model was applied to non-stationary series, so we checked whether the series was non-stationary. We chose the Augmented Dickey Fuller (ADF) test [11] to check if the series is stationary, and to determine the value of the model order d. The second step was the model order determination. Thus, we used the autocorrelation function (ACF) graph and partial autocorrelation function (PACF) graph to select the p and q. The third step was the model testing and diagnosis. The white noise test of residuals was performed using the Box.test function [11]. The Lagrange multiplier (LM) test of residuals was performed using the ArchTest function [21]. The model passed the above test (p > 0.05), indicating that the model was applicable to the time series of the number of people with diabetes. The final step was the prediction. We predicted the number of people with diabetes from 2019 to 2025. The model fitting effects were evaluated by the root mean squared error (RMSE), mean absolute error (MAE), mean absolute percentage error (MAPE), average relative error and coefficient of determination
Economic Burden of Diabetes
Model Introduction
Bottom-up approach is a method to estimate the economic burden of disease by the product of unit cost and the number of patients [22]. The human capital approach is a method of calculating future income that is reduced due to mortality and/or morbidity [23].
Total Economic Burden Estimation Process
Since the intangible economic burden was difficult to express in monetary terms, we chose the following method to estimate the total economic burden [24].
Direct Economic Burden Estimation Process
We chose the bottom-up approach to estimate the direct economic burden. The direct economic burden of diabetes from 2019 to 2025 was estimated by selecting the annual cost of treatment per capita of diabetes in 2019 published by the National Health Insurance Administration of China, the number of people with diabetes in 2019 published by GBD, and the number of people with diabetes from 2020 to 2025 predicted by using ARIMA model. The method was as follows:
Indirect Economic Burden Estimation Process
The human capital approach was used to estimate the indirect economic burden. The indirect economic burden of diabetes and indirect economic burden per capita in 2019 were estimated by selecting the GNI per capita in 2019, the DALYs of Chinese diabetes for different age groups in 2019 published by GBD, and the productivity weighted for different age groups: 0.15 for 0–14 years; 0.75 for 15–44 years; 0.80 for 45–59 years; and 0.10 for 60 years or older [25, 26]. To estimate the indirect economic burden of diabetes from 2019 to 2025, the methods were as follows:
Results
Prediction Results
We created a time series with the natural logarithmic transformation of the number of people with diabetes in China from 2000 to 2018. The ADF test was statistically significant (p < 0.05) after first differencing. We estimated the parameters
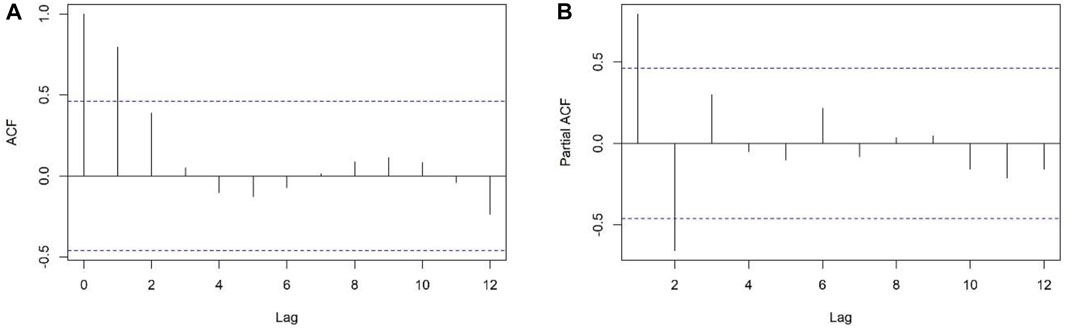
FIGURE 1. Autocorrelation function graph (A) and partial autocorrelation function graph (B) after differencing the time series, Predicting and Estimating Diabetes Burden, China, 2000–2018.
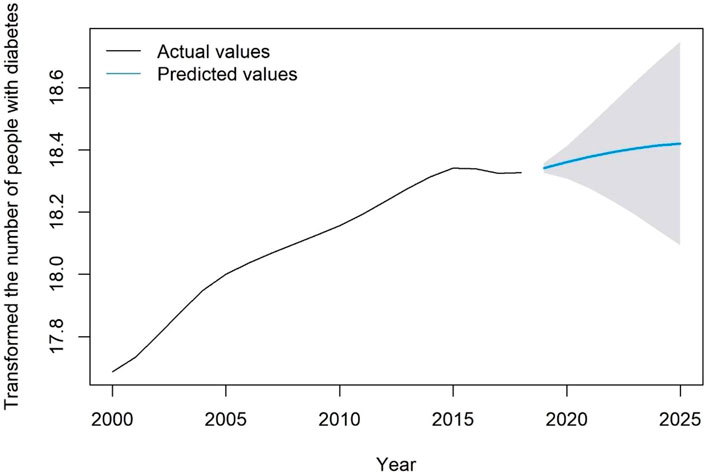
FIGURE 2. Fitted and predicted values for the number of people with diabetes after natural logarithmic transformation, Predicting and Estimating Diabetes Burden, China, 2000–2025.
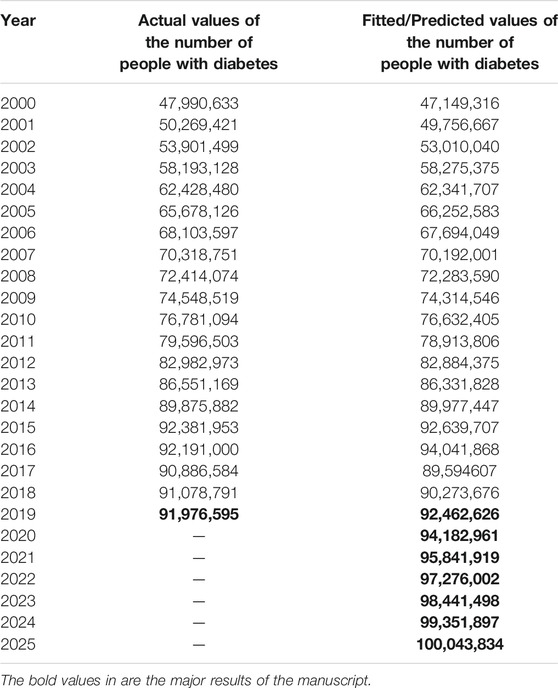
TABLE 1. Prediction results of diabetes prevalence trend, Predicting and Estimating Diabetes Burden, China, 2000–2025.
Prevalence Trends
The general trend in the number of people with diabetes in China would increase from 2000 to 2025, as shown in Figure 3.
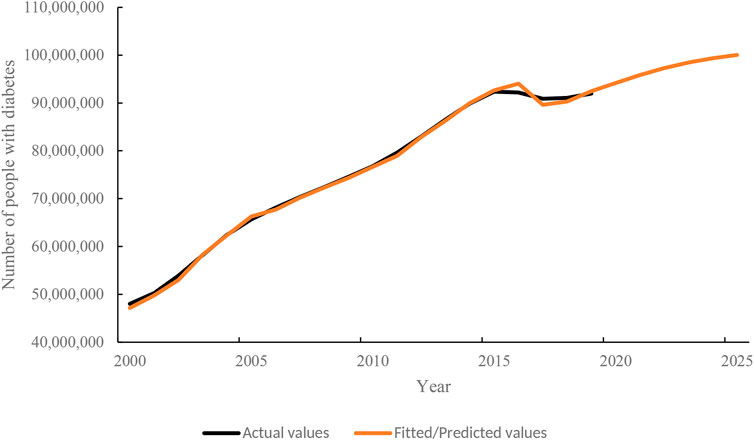
FIGURE 3. The prevalence trend of diabetes in the future, Predicting and Estimating Diabetes Burden, China, 2000–2025.
Estimated Results of Economic Burden of Diabetes
The specific estimated results of the direct economic burden of diabetes in China were respectively 115,154,696,940, 117,917,067,172, 119,994,082,588, 121,789,554,504, 123,248,755,496, 124,388,575,044 and 125,254,880,168 from 2019 to 2025, as shown in Table 2. The estimated indirect economic burden of diabetes was about $41 billion, and the indirect economic burden per capita was about $447 in China in 2019, as shown in Table 3. The values of the total economic burden of diabetes in China were 156,302,288,326, 160,016,850,739, 162,835,420,381, 165,271,927,398, 167,252,105,102, 168,798,873,003 and 169,974,473,966 from 2019 to 2025, respectively (Supplemental Table S2).
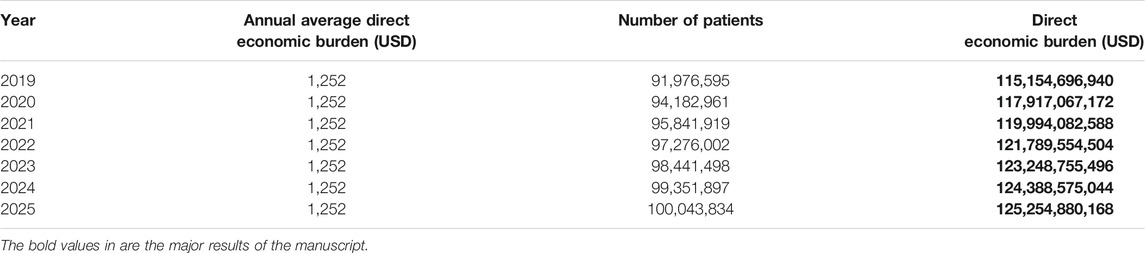
TABLE 2. Direct economic burden of diabetes in China from 2019 to 2025, Predicting and Estimating Diabetes Burden, China, 2019–2025.
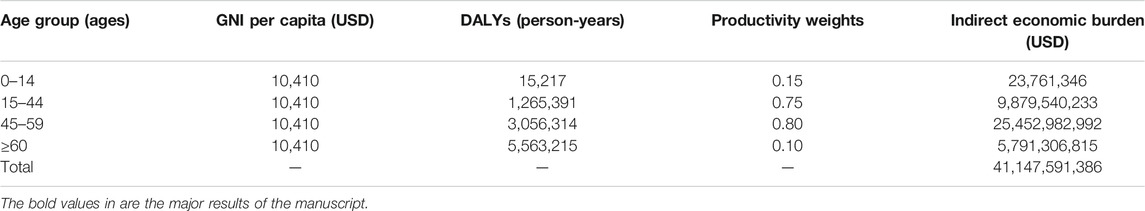
TABLE 3. Indirect economic burden of diabetes in China in 2019, Predicting and Estimating Diabetes Burden, China, 2019.
Discussion
The results show that the number of people with diabetes in China was on the rise from 2000 to 2019. The number of people with diabetes in China have surpassed 90 million per year since 2015. The possible reasons are as follows: Firstly, with the rapid societal transition, the rapid economic growth, and the rapid ageing of the population in China all lead to the increase in the number of people susceptible to diabetes [27, 28]. Secondly, dietary shifts towards westernized diets, such as increased intake of sugary drinks, dietary fats and red meat, and a shift towards recycled grains, all appear to increase the prevalence of diabetes in China [29]. Thirdly, sedentary lifestyle increases the risk of diabetes [30]. Fourthly, high-intensity social competition has led to a general increase in psychological stress in the population, especially in the middle-aged and elderly; high psychological stress can cause an increase in grain intake, which may be a risk factor for the development of diabetes [31]. Fifthly, the adult overweight and obesity rate increased rapidly in the last 20 years [32] and recent survey shows that more than 50% of adults are either overweight or obesity in China [33]. The onset of obesity and diabetes is associated with factors such as the c-Jun amino-terminal kinases (JNK) and the IκB kinase β (IKK-β), which cause insulin resistance and ultimately cause diabetes [34, 35]. Since the serious situation of diabetes in China, we should strengthen diabetes prevention and control, conduct early screening for diabetes, and prevent and manage diabetes complications actively.
In this study, ARIMA (2,1,1) model was used to predict the number of people with diabetes from 2020 to 2025. RMSE, MAE, MAPE,
According to our study, the total economic burden of diabetes in China are about $156 billion, $160 billion, $163 billion, $165 billion, $167 billion, $169 billion and $170 billion from 2019 to 2025 respectively, showing an increasing trend. The total economic burden of diabetes in 2019 accounted for about 1% of China’s Gross Domestic Product (GDP), of which the direct economic burden was about 12% of the total national health cost. The heavy economic burden of diabetes may be related to the following factors: Firstly, life expectancy per capita increased from 71.4 years in 2000 to 77.3 years in 2019, due to rapid aging in China, which is the most fundamental reason for the increasing trend of diabetes prevalence [40, 41]. Meanwhile, the treatment cost per capita and GNI per capita also rise. The results of this study are consistent with those of the International Diabetes Federation [5]. Secondly, diabetes as a chronic disease is characterized by a long course of disease, inevitably, the economic burden of diabetes increases every year. Thirdly, 76.40% of people with diabetes in China have reported at least one complication, and the treatment cost per capita for these patients is much higher than for patients with uncomplicated diabetes, thus creating a heavier economic burden [42].Based on the current serious situation of diabetes prevention and control in China, the study recommends the following measures. Firstly, authorities need to scientifically and actively promote the Notice of the General Office of the State Council on the Issuance of the Medium and Long-term Plan for the Prevention and Control of Chronic Diseases in China (2017–2025) [43]. Secondly, the primary health service system needs improvements, such as, to establish a database of diabetes monitoring system, and to encourage professionals to work in community health institutions through incentive mechanisms [44]. The authorities need to promote universal health coverage and raise awareness of diabetes prevention and control. Thirdly, the social security system should better combine health insurance and commercial insurance, and increase the reimbursement ratio of both, lower the starting standard of diabetes medical insurance, and set up a separate medical insurance funding mechanism for diabetes. Meanwhile, it is recommended that commercial insurance companies actively participate in the prevention of diabetes, provide health checkups for the insured, and lower the threshold of commercial insurance coverage, to reduce the economic burden of diabetes. Fourthly, we need to change the dietary structure and establish sensible dietary patterns to prevent and control diabetes [45]; encourage people to participate in sports to improved insulin sensitivity and optimized body mass index [46]; and reduce the risk of developing diabetes, so as to achieve the purpose of preventing and controlling diabetes.
Limitations
There are some limitations in the study. Firstly, the ARIMA model is better at predicting data in the short term in the future [12], so we only predicted the number of people with diabetes from 2020 to 2025. Secondly, we used the treatment cost per capita and GNI per capita in 2019 to estimate the economic burden of diabetes from 2020 to 2025, without taking inflation into account. Thirdly, the proportion of people with a 2-week illness that is not treated is approximately 1.7% in China in 2018 [47]; therefore, using the number of people with diabetes instead of the number of inpatients with diabetes might overestimate the direct economic burden of diabetes, which requires further investigation of consultation and hospitalization rates to estimate the direct economic burden accurately.
Conclusion
The ARIMA model prediction results indicated that the number of people with diabetes in China is would increase in the future. The ARIMA (2,1,1) model can be used to predict the number of people with diabetes in China. The economic burden of diabetes in China would also become heavier in the future. We call for government leadership and universal participation to improve diabetes-related health policies, and to achieve the purpose of preventing and controlling diabetes in China.
Author Contributions
DiZ: economic analysis, methodology, writing the original draft, reviewing and editing. DoZ: conceptualization, investigation, methodology, supervision, reviewing and editing. NL: conceptualization, investigation, methodology, reviewing and editing. BH: conceptualization, funding acquisition, investigation, methodology, project administration, supervision, reviewing and editing.
Conflict of Interest
The authors declare that the research was conducted in the absence of any commercial or financial relationships that could be construed as a potential conflict of interest.
Supplementary Material
The Supplementary Material for this article can be found online at: https://www.ssph-journal.org/articles/10.3389/ijph.2021.1604449/full#supplementary-material
References
1.World Health Organization. WHO Diabetes (2021). Available at: https://www.who.int/news-room/fact-sheets/detail/diabetes (Accessed June 30, 2021).
2. Lozano, R, Naghavi, M, Foreman, K, Lim, S, Shibuya, K, Aboyans, V, et al. Global and Regional Mortality from 235 Causes of Death for 20 Age Groups in 1990 and 2010: A Systematic Analysis for the Global Burden of Disease Study 2010. Lancet (2012) 380(9859):2095–128. doi:10.1016/S0140-6736(12)61728-0
3. Bommer, C, Heesemann, E, Sagalova, V, Manne-Goehler, J, Atun, R, Bärnighausen, T, et al. The Global Economic burden of Diabetes in Adults Aged 20-79 Years: a Cost-Of-Illness Study. Lancet Diabetes Endocrinol (2017) 5(6):423–30. doi:10.1016/S2213-8587(17)30097-9
4.Global Health Data Exchange (GHDx). GBD Results Tool (2021). Available at: http://ghdx.healthdata.org/gbd-results-tool (Accessed June 21, 2021).
5.International Diabetes Federation. IDF Diabetes Atlas. 9th ed. Brussels,Belgium: IDF (2019). Available at: https://www.diabetesatlas.org (Accessed May 27, 2021).
6.National Bureau of Statistics of China. China Statistical Yearbook (2020). Available at: http://www.stats.gov.cn/tjsj/ndsj/2020/indexch.htm (Accessed June 22, 2021).
7. Xu, Y, Wang, L, He, J, Bi, Y, Li, M, Wang, T, et al. Prevalence and Control of Diabetes in Chinese Adults. JAMA (2013) 310(9):948–59. doi:10.1001/jama.2013.168118
8. Sato, RC. Gerenciamento de doenças utilizando séries temporais com o modelo ARIMA. Einstein (São Paulo) (2013) 11(1):128–31. English, Portuguese. doi:10.1590/s1679-45082013000100024
9. Earnest, A, Evans, SM, Sampurno, F, and Millar, J. Forecasting Annual Incidence and Mortality Rate for Prostate Cancer in Australia until 2022 Using Autoregressive Integrated Moving Average (ARIMA) Models. BMJ Open (2019) 9(8):e031331–7. doi:10.1136/bmjopen-2019-031331
10. Zhao, X, Li, C, Ding, G, Heng, Y, Li, A, Wang, W, et al. The Burden of Alzheimer's Disease Mortality in the United States, 1999-2018. Jad (2021) 82(2):803–13. doi:10.3233/jad-210225
11. Ray, S, Das, SS, Mishra, P, and Al Khatib, AMG. Time Series SARIMA Modelling and Forecasting of Monthly Rainfall and Temperature in the South Asian Countries. Earth Syst Environ (2021) 5(3):531–46. doi:10.1007/s41748-021-00205-w
12. Dou, Z-W, Ji, M-X, Wang, M, and Shao, Y-N. Price Prediction of Pu'er tea Based on ARIMA and BP Models. Neural Comput Applic (2021) 16:1–17. doi:10.1007/s00521-021-05827-9
13. Ray, S, Bhattacharyya, B, and Pal, S. Statistical Modeling and Forecasting of Food Grain in Effects on Public Distribution System: An Application of ARIMA Model. Indi Jour Econ Develop (2016) 12(4):739–44. doi:10.5958/2322-0430.2016.00199.2
14. Bommer, C, Sagalova, V, Heesemann, E, Manne-Goehler, J, Atun, R, Bärnighausen, T, et al. Global Economic Burden of Diabetes in Adults: Projections from 2015 to 2030. Dia Care (2018) 41(5):963–70. doi:10.2337/dc17-1962
15. Jo, C. Cost-of-illness Studies: Concepts, Scopes, and Methods. Clin Mol Hepatol (2014) 20(4):327–37. doi:10.3350/cmh.2014.20.4.327
16. Ettaro, L, Songer, TJ, Zhang, P, and Engelgau, MM. Cost-of-illness Studies in Diabetes Mellitus. Pharmacoeconomics (2004) 22(3):149–64. doi:10.2165/00019053-200422030-00002
17. Ding, D, Lawson, KD, Kolbe-Alexander, TL, Finkelstein, EA, Katzmarzyk, PT, van Mechelen, W, et al. The Economic burden of Physical Inactivity: a Global Analysis of Major Non-communicable Diseases. The Lancet (2016) 388(10051):1311–24. doi:10.1016/S0140-6736(16)30383-X
18. Pflaumer, P. Forecasting US Population Totals with the Box-Jenkins Approach. Int J Forecast (1992) 8(3):329–38. doi:10.1016/0169-2070(92)90051-a
19. Linden, A, Adams, JL, and Roberts, N. Evaluating Disease Management Program Effectiveness: An Introduction to Survival Analysis. Dis Manage (2004) 7(3):180–90. doi:10.1089/dis.2004.7.180
20. Kwiatkowski, D, Phillips, PCB, Schmidt, P, and Shin, Y. Testing the Null Hypothesis of Stationarity against the Alternative of a Unit Root. How Sure Are We that Economic Time Series Have a Unit Root? J Econom (1992) 54(1-3):159–78. doi:10.1016/0304-4076(92)90104-Y
21. Hussin, NH, Yusof, F, Jamaludin, AR, and Norrulashikin, SM. Forecasting Wind Speed in Peninsular Malaysia: An Application of Arima and Arima-Garch Models. Jst (2021) 29(1):31–58. doi:10.47836/pjst.29.1.02
22. Tarricone, R. Cost-of-illness Analysis. Health Policy (2006) 77(1):51–63. doi:10.1016/j.healthpol.2005.07.016
23. Liljas, B. How to Calculate Indirect Costs in Economic Evaluations. Pharmacoeconomics (1998) 13(1 PART I):1–7. doi:10.2165/00019053-199813010-00001
24. Afroz, A, Alramadan, MJ, Hossain, MN, Romero, L, Alam, K, Magliano, DJ, et al. Cost-of-illness of Type 2 Diabetes Mellitus in Low and Lower-Middle Income Countries: A Systematic Review. BMC Health Serv Res (2018) 18(1):972. doi:10.1186/s12913-018-3772-8
25. Xu, K, and Hu, S. Analysis of the Economic burden of Disease from the Perspective of the Whole Society. China: China Heal Econ (1994). p. 56–8. 6
26. Barnum, H. Evaluating Healthy Days of Life Gained from Health Projects. Soc Sci Med (1987) 24(10):833–41. doi:10.1016/0277-9536(87)90184-5
27. Chan, JCN, Zhang, Y, and Ning, G. Diabetes in China: A Societal Solution for a Personal challenge. Lancet Diabetes Endocrinol (2014) 2(12):969–79. doi:10.1016/S2213-8587(14)70144-5
28. Bloomgarden, Z, and Ning, G. Diabetes and Aging (糖尿病与老龄化). J Diabetes (2013) 5(4):369–71. doi:10.1111/1753-0407.12086
29. Ma, RCW, Lin, X, and Jia, W. Causes of Type 2 Diabetes in China. Lancet Diabetes Endocrinol (2014) 2(12):980–91. doi:10.1016/S2213-8587(14)70145-7
30. Arocha Rodulfo, JI. Sedentarism, a Disease from Xxi century. Clínica e Investigación en Arteriosclerosis (English Edition) (2019) 31(5):233–40. English, Spanish. doi:10.1016/j.artere.2019.04.001
31. Shin, Y, and Kim, Y. Psychological Stress Accompanied by a Low-Variety Diet Is Positively Associated with Type 2 Diabetes in Middle-Aged Adults. Nutrients (2020) 12(9):2612. doi:10.3390/nu12092612
32. Pan, X-F, Wang, L, and Pan, A. Epidemiology and Determinants of Obesity in China. Lancet Diabetes Endocrinol (2021) 9(6):373–92. doi:10.1016/S2213-8587(21)00045-0
33.The State Council of the People’s Republic of China. The State Council Information Office of the People’s Republic of China. Press Briefing for the Report on Chinese Residents’ Chronic Diseases and Nutrition 2020 (2020). Available at: http://www.gov.cn/xinwen/2020-12/24/content_5572983.htm (Accessed June 24, 2021).
34. Hirosumi, J, Tuncman, G, Chang, L, Görgün, CZ, Uysal, KT, Maeda, K, et al. A central Role for JNK in Obesity and Insulin Resistance. Nature (2002) 420(6913):333–6. doi:10.1038/nature01137
35. Arkan, MC, Hevener, AL, Greten, FR, Maeda, S, Li, Z-W, Long, JM, et al. IKK-β Links Inflammation to Obesity-Induced Insulin Resistance. Nat Med (2005) 11(2):191–8. doi:10.1038/nm1185
36. Ilie, O-D, Cojocariu, R-O, Ciobica, A, Timofte, S-I, Mavroudis, I, and Doroftei, B. Forecasting the Spreading of COVID-19 across Nine Countries from Europe, Asia, and the American Continents Using the Arima Models. Microorganisms (2020) 8(8):1158. doi:10.3390/microorganisms8081158
37. Aryee, G, Kwarteng, E, Essuman, R, Nkansa Agyei, A, Kudzawu, S, Djagbletey, R, et al. Estimating the Incidence of Tuberculosis Cases Reported at a Tertiary Hospital in Ghana: a Time Series Model Approach. BMC Public Health (2018) 18(1):1–8. doi:10.1186/s12889-018-6221-z
38. Ferrão, JL, Earland, D, Novela, A, Mendes, R, Tungadza, A, and Searle, KM. Malaria Temporal Variation and Modelling Using Time-Series in Sussundenga District, Mozambique. Ijerph (2021) 18(11):5692. doi:10.3390/ijerph18115692
39. Lin, H, Shi, L, Zhang, J, Zhang, J, and Zhang, C. Epidemiological Characteristics and Forecasting Incidence for Patients with Breast Cancer in Shantou, Southern China: 2006-2017. Cancer Med (2021) 10(8):2904–13. doi:10.1002/cam4.3843
40.National Bureau of Statistics of China. National Data (2021). Available at: https://data.stats.gov.cn/easyquery.htm?cn=C01&zb=A0304&sj=2000 (Accessed November 4, 2021).
41.National Health Commission of the People’s Republic of China. Statistical Bulletin on the Development of Health Care in China in 2019 (2020). Available at: http://www.nhc.gov.cn/guihuaxxs/s10748/202006/ebfe31f24cc145b198dd730603ec4442.shtml (Accessed November 4, 2021).
42. Hu, H, Sawhney, M, Shi, L, Duan, S, Yu, Y, Wu, Z, et al. A Systematic Review of the Direct Economic Burden of Type 2 Diabetes in China. Diabetes Ther (2015) 6(1):7–16. doi:10.1007/s13300-015-0096-0
43.The State Council of the People’s Republic of China. Circular of the General Office of the State Council on Printing and Issuing the China’s Medium- and Long-Term Plan for Prevention and Treatment of Chronic Diseases (2017-2025) (2017). Available at: http://www.gov.cn/zhengce/content/2017-02/14/content_5167886.htm (Accessed October 31, 2021).
44. Fang, P, Liu, X, Huang, L, Zhang, X, and Fang, Z. Factors that Influence the Turnover Intention of Chinese Village Doctors Based on the Investigation Results of Xiangyang City in Hubei Province. Int J Equity Health (2014) 13:84. doi:10.1186/s12939-014-0084-4
45. Jannasch, F, Kröger, J, and Schulze, MB. Dietary Patterns and Type 2 Diabetes: A Systematic Literature Review and Meta-Analysis of Prospective Studies. J Nutr (2017) 147(6):1174–82. doi:10.3945/jn.116.242552
46. Yang, D, Yang, Y, Li, Y, and Han, R. Physical Exercise as Therapy for Type 2 Diabetes Mellitus: From Mechanism to Orientation. Ann Nutr Metab (2019) 74(4):313–21. doi:10.1159/000500110
47.National Health Commission of the People’s Republic of China. Accessibility of Medical and Health Services for Urban and Rural Residents Improved in China--An Analysis Report of the Sixth National Health Services Survey in China (2021). Available at: http://www.nhc.gov.cn/mohwsbwstjxxzx/s2908/202101/0838723e3f3a4adb835d970abd551665.shtml (Accessed June 17, 2021).
Keywords: China, diabetes, ARIMA model, economic burden, prevalence trend
Citation: Zhu D, Zhou D, Li N and Han B (2022) Predicting Diabetes and Estimating Its Economic Burden in China Using Autoregressive Integrated Moving Average Model. Int J Public Health 66:1604449. doi: 10.3389/ijph.2021.1604449
Received: 05 September 2021; Accepted: 16 December 2021;
Published: 20 January 2022.
Edited by:
Calogero Guccio, University of Catania, ItalyReviewed by:
Thenmozhi M., Indian Institute of Technology Madras, IndiaCopyright © 2022 Zhu, Zhou, Li and Han. This is an open-access article distributed under the terms of the Creative Commons Attribution License (CC BY). The use, distribution or reproduction in other forums is permitted, provided the original author(s) and the copyright owner(s) are credited and that the original publication in this journal is cited, in accordance with accepted academic practice. No use, distribution or reproduction is permitted which does not comply with these terms.
*Correspondence: Bing Han, bhan@cmu.edu.cn