Abstract
Objectives: To describe and assess the risk of bias of the primary input studies that underpinned the Global Burden of Disease Study (GBD) 2019 modelled prevalence estimates of low back pain (LBP), neck pain (NP), and knee osteoarthritis (OA), from Australia, Brazil, Canada, Spain, and Switzerland. To evaluate the certainty of the GBD modelled prevalence evidence.
Methods: Primary studies were identified using the GBD Data Input Sources Tool and their risk of bias was assessed using a validated tool. We rated the certainty of modelled prevalence estimates based on the GRADE Guidelines 30―the GRADE approach for modelled evidence.
Results: Seventy-two primary studies (LBP: 67, NP: 2, knee OA: 3) underpinned the GBD estimates. Most studies had limited representativeness of their study populations, used suboptimal case definitions and applied assessment instruments with unknown psychometric properties. The certainty of modelled prevalence estimates was low, mainly due to risk of bias and indirectness.
Conclusion: Beyond the risk of bias of primary input studies for LBP, NP, and knee OA in GBD 2019, the certainty of country-specific modelled prevalence estimates still have room for improvement.
Introduction
Since its first publication in 1993, the Global Burden of Disease Study (GBD) has become a reference in the estimation of disease burden, including for musculoskeletal (MSK) disorders [1]. According to GBD 2019, MSK disorders ranked globally first in terms of years lived with disability (YLD) and sixth in disability adjusted life years (DALY) across all diseases [1]. While prevalence estimates vary [2–4], it has been suggested that one in three people live with a chronic, painful MSK condition [5]. Among MSK disorders, low back pain (LBP), neck pain (NP), and knee osteoarthritis (OA) are especially burdensome, motivating focused GBD analyses and calls for action [6, 7].
Due to the ambitious aim of estimating prevalence, and other disease metrics impacted by prevalence (i.e., YLD, DALY) for 204 countries and territories between 1990 and 2019, GBD 2019 estimates rely on modelling data, especially when primary data are scarce [8, 9]. This dependence on complex modelling techniques is accentuated in low- and middle-income countries, where the lack of infrastructure limits periodic epidemiologic studies and where MSK disorders are often overlooked [10]. Given the proportion of people not seeking care for MSK pain, burden estimation faces specific challenges due to the lack of suitability of routine administrative data sources (i.e., hospital and claims data) for this purpose, and its unique DALY profile, which is almost exclusively dependent on YLD. Despite a recent study on the completeness of primary LBP prevalence data in GBD 2017 [11], little is known about the characteristics and risk of bias of the primary data input studies that underpinned the GBD 2019 modelled prevalence estimates of LBP, NP, and knee OA, as well as the certainty of these estimates.
As GBD metrics might guide health decision-making and resource allocation, the application of approaches to rate the certainty of GBD modelled estimates for MSK conditions is relevant. Complementary to advances in quality rating systems in GBD (i.e., star rating in Burden of Proof studies) [12], the Grading of Recommendations, Assessment, Development and Evaluation (GRADE) working group offers an intuitive approach to rate the certainty of a body of evidence and, thus, the confidence we can place on it, according to risk of bias, inconsistency, indirectness, imprecision, reporting bias, magnitude of an effect, dose-response relation, and the direction of residual confounding [13]. Beyond the wide use of GRADE in systematic reviews and clinical practice guidelines, important variations have emerged for other types of evidence [14], including modelling studies [15]. Following recommendations to use GRADE for modelling studies to improve World Health Organization (WHO) guidelines [16], this framework has yet to be applied to GBD epidemiologic estimates.
Objectives
This meta-epidemiological work aims to: 1) describe and assess the risk of bias of the primary input studies that underpinned the GBD 2019 modelled prevalence estimates of LBP, NP, and knee OA, from five countries (Australia, Brazil, Canada, Spain, and Switzerland), and 2) evaluate the certainty of the modelled prevalence evidence using GRADE.
Methods
Data Identification and Retrieval
We adhered to applicable items of the guidelines for reporting meta-epidemiological research (Supplementary Datasheet S1) [17]. For our search strategy―carried out between December 2021 and April 2022―one reviewer independently used the GBD 2019 Data Input Sources Tool to systematically identify all primary data input studies. These were operationalised as peer-reviewed epidemiological studies and non-peer-reviewed national and international survey reports that informed the GBD 2019 modelled prevalence estimates of LBP, NP, and knee OA for Australia, Brazil, Canada, Spain, and Switzerland between 1990 and 2019 (Supplementary Datasheet S1 p 3). Primary data input studies were eligible if they were indexed in the 2019 Data Input Sources Tool and the Supplementary Appendix 1 of the GBD 2019 publication [1]. The GBD 2019 Supplementary Appendix 1 provides a rationale for the specific study characteristics used as eligibility criteria in the prevalence estimation of LBP, NP, and knee OA. We did not consider additional databases or internet searches, and we did not contact experts beyond those in the author group to identify additional studies. We selected the three most prevalent MSK pain conditions investigated in the GBD 2019 Study (LBP, NP, and knee OA) and five countries covering four world continents. Although these are primarily high-income countries, our country selection took into consideration the trade-off between the scope of the work, external validity, and our limited resource constraints. In addition, our pragmatic decision to select Australia, Brazil, Canada, Spain, and Switzerland considered their diverse healthcare systems, as well as the language skills and relevance of these countries to the authors. Before strategic selection and protocol specification, we conducted a preliminary search and gained information on the availability of at least some primary data coverage for the three most prevalent MSK pain conditions the GBD 2019 Study for these five territories. We excluded other sources of input data, mainly opportunistic surveys, and insurance claims, as they were not identifiable through the GBD website or GBD 2019 Study Supplementary Appendices. Our protocol was registered on the Open Science Framework [18].
All primary input studies were independently retrieved for risk of bias assessment and data extraction. When primary input studies were not accessible by conventional means (i.e., via electronic academic journals or scientific search engines), alternative approaches were tried, including searching open-source repositories and directly contacting primary study authors by email. In the case of the World Health Survey and the Swiss Household Panel Survey, two formal applications were completed and granted via the WHO Multi-Country Studies Data Archive (an open-access WHO repository) and the SWISSUbase system (a cross-disciplinary Swiss repository), respectively (Supplementary Datasheet S1 p 3).
Descriptive Analysis
One reviewer independently tabulated key information from primary input studies, including their sampling frame (national vs. subnational), sampling design, sample size, response proportion, years covered, sample age range, proportion of female participants, case definition for LBP, NP, or knee OA with applicable prevalence periods, and prevalence estimates with 95% confidence intervals (CIs). Prevalence periods were extracted from the ‘Methods’ section or from instruments referenced in primary input studies. For instance, if a primary input study asked about pain lasting 1 day or longer during the preceding month in the lumbar area, this was considered a one-month prevalence period. Prevalence was operationalised as the proportion of cases of LBP, NP, or knee OA in the included study populations. All extractable variables were prespecified in our protocol. When only strata-specific prevalence estimates were reported in primary studies (i.e., overall prevalence estimates not reported), we combined these into a single age and sex combined point estimate, conditional on having enough data granularity for the given study (total N, N for each individual age and sex stratum, and prevalence estimate for each stratum). Similarly, when interval estimates were not reported for prevalence point estimates, we derived 95% CIs, if possible, using Wald standard errors accounting for sampling design effects (see Supplementary Datasheet S1 p 4 for details) [2]. We did not use additional processes for manipulating data.
Risk of Bias Assessment
To assess risk of bias in primary input studies, we used a tool validated by Hoy et al. (Supplementary Datasheet S1 pp 5–8) [19], which has shown high interrater reliability in population-based cross-sectional studies of LBP [2], NP [20], and knee OA [21]. Ten criteria were rated as “low” or “high” risk of bias for each study: 1) representativeness of the target population in relation to the national population, 2) representativeness of the sampling frame in relation to the target population, 3) inclusion of random selection or a census, 4) likelihood of non-response bias, 5) collection of data directly from the subjects (as opposed to a proxy), 6) use of an acceptable case definition with anatomical specification, 7) use of a study instrument to measure prevalence with known reliability and validity, 8) uniformity in the mode of data collection, 9) appropriateness of the length of the shortest prevalence period for the parameter of interest, and (10) appropriateness of the numerator and denominator for the prevalence estimate. An additional summary item, added to the risk of bias visualizations [22], indicated how likely it would be for further research to change the confidence in the value of an observed prevalence estimate derived from a primary study. To ensure consistent and reliable risk of bias ratings and judgments, we conducted a training and calibration phase for the use of the tool and assessed interrater reliability. Two reviewers (JML and CAH) independently evaluated 20 (28%) of the 72 studies (randomly selected) and obtained 92% agreement on ratings and a kappa of 0.82 (95% CI, 0.73–0.91), suggesting high agreement beyond chance.
Certainty of GBD Prevalence Estimates
We performed a certainty assessment of the GBD 2019 modelled prevalence estimates using GRADE Guidelines 30—the GRADE approach for modelled evidence [15]. GRADE Guidelines 30 maintains general concepts of the GRADE approach and proposes a framework for selecting the best available evidence from one or more models to inform healthcare decisions. We selected these guidelines due to their applicability to health decision-making. Even though no specific guidance is available for applying GRADE to modelled prevalence estimates, GRADE Guidelines 30 allowed the identification of an existing model (GBD 2019) that a priori provided the highest certainty evidence for modelled prevalence of LBP, NP, and knee OA between 1990 and 2019. Due to the nature of our modelled outcome of interest, we performed assessments based on the GRADE criteria of risk of bias, inconsistency, indirectness, and imprecision of modelled prevalence estimates [15].
GRADE application began with the assessment of risk of bias, by which country-specific modelled prevalence estimates were evaluated based on the credibility of the disease-specific model (i.e., conceptualization, structure, calibration, and other factors) and the certainty of evidence in each of its inputs (i.e., whether model inputs represented the entire body of relevant evidence satisfying clear prespecified criteria). We then qualitatively assessed modelled prevalence estimates for indirectness based on two subdomains: indirectness of model inputs with respect to the model (based on the presence of country-specific primary input studies), and indirectness of model outputs with respect to the national MSK modelled estimation of interest. The third step involved assessing inconsistency of modelled estimates, by examining the variability in the modelled prevalence estimates over the study period. Lastly, we evaluated modelled estimates for imprecision by judging the width of modelled uncertainty intervals. Due to the nature of our modelled outcome of interest, we did not consider additional GRADE criteria (i.e., dose-response gradient, large magnitude of effect, and effect of an opposite direction of plausible residual confounding) to be applicable.
Patient and Public Involvement
Patients and members of the public were not involved in this study due to resource limitations. Nonetheless, we intend to involve the public in disseminating our results, including via social media platforms, newsletters, and conferences.
Results
Data Identification, Availability, and Coverage Between 1990 and 2019
We identified 72 primary data input studies (LBP: 67, NP: 2, knee OA: 3; Australia: 12; Brazil: 11; Canada: 8; Spain: 22; Switzerland: 19) in the GBD 2019 Data Input Sources Tool. After accounting for two studies providing input on LBP in two countries [23, 24], and two studies informing two MSK conditions in the same country [25, 26], 68 distinct primary input studies were identified and assessed for eligibility (Table 1; Supplementary Datasheet S1 p 9). Full texts, primary reports, or microdata (to obtain prevalence estimates when full texts or primary reports were not available) were retrieved for all studies. The World Health Survey for Australia was not available in the WHO central data catalogue—microdata and a report were provided by the WHO Department of Noncommunicable Diseases [33]. For the Swiss Household Panel Survey, since no periodic national reports were published, information was retrieved from microdata and other methodological publications [89, 90]. One of the input studies for Australia was a misclassified Austrian study [42]. Overall, Spain and Switzerland had the highest number of primary input studies for LBP (N = 19 each), while Canada had the lowest number (N = 7). Only the years 2000 and 2002 had at least one primary input study in all five included countries for LBP, and most of the studies were clustered between 1999 and 2010. Eight of the 30 included years did not have primary data coverage in any of the countries for LBP. For NP, only Spain and Brazil had primary data input studies, while for knee OA, this was the case for Spain and Canada (Figure 1; Supplementary Datasheet S1 pp 10–12).
TABLE 1
| Study | RoB | N | Period | Prevalence % | Study | RoB | N | Period | Prevalence % |
|---|---|---|---|---|---|---|---|---|---|
| LBP — Australia | LBP — Spain (cont.) | ||||||||
| NHS 1995 [27, 28] | Mod | 53,828 | Point | 17.6 (17.0–18.2) | Miró 2007 [75] | Low | 592 | 3 mo | 43.9 (39.9–47.9) |
| NHS 2001 [29, 30] | Mod | 26,863 | Point | 21.0 (20.4–21.6) | Pellisé 2009 [23] | Low | 1,470 | 1 mo | 39.8 (36.3–43.3) |
| SDAC 2003 [31, 32] | Mod | 41,386 | 12 mo | 3.1 (2.9–3.3) | HBSC 2010 [76] | Mod | 11,230 | 6 mo | 38.1 (36.8–39.4) |
| WHS 2003 [33] | Mod | 1,846 | 1 mo | 44.1 (40.8–47.3) | Fernández de las Peñas 2011 [77, 78] | Low | 29,478 | 12 mo | 19.9 (19.3–20.5) |
| Walker 2004 [34] | Low | 1,913 | Point | 25.6 (23.7–27.6) | Balagué 2012 [24] | Low | 1,470 | 1 mo | 39.8 (36.3–43.3) |
| NHS 2004–2005 [35, 36] | Mod | 25,906 | Point | 16.4 (15.8–17.0) | Eurobarometer 2012 [79, 80] | Low | 1,026 | 1 wk | 7.9 (6.0–9.8) |
| Grimmer 2006 [37] | Low | 434 | 1 wk | 7.1 (3.7–10.5) | Jiménez Sánchez 2012 [26, 81] | Mod | 12,190 | 12 mo | 11.1 (10.5–11.7) |
| NHS 2007–2008 [38, 39] | Mod | 20,788 | Point | 14.5 (13.7–15.3) | Rodríguez Oviedo 2012 [82] | High | 1,403 | 12 mo | 25.9 (22.7–29.1) |
| SDAC 2009 [40, 41] | Mod | 73,683 | 12 mo | 2.9 (2.8–3.0) | Vargas Prada 2013 [83] | Mod | 1,105 | 12 mo | 63.6 (59.6–67.6) |
| HBSC Austria 2010 [42] | Mod | 6,493 | 6 mo | 37.1 (35.4–38.8) | Mesas 2014 [84, 85] | Low | 8,283 | 12 mo | 14.1 (13.4–14.8) |
| Broom 2012 [43] | Mod | 9,820 | 12 mo | 54.8 (53.8–55.8) | Koyanagi 2015 [86, 87] | Mod | 3,625 | 1 mo | 45.1 (42.2–48.0) |
| O'Sullivan 2012 [44] | Mod | 1,288 | 1 mo | 12.3 (9.8–14.8) | LBP — Switzerland | ||||
| LBP — Brazil | Balagué 1994 [88] | Mod | 1,716 | 1 wk | 12.0 (10.4–13.6) | ||||
| WHS 2003 [45] | Low | 4,999 | 1 mo | 52.6 (50.6–54.6) | HBSC 1998 [56] | Mod | 5,520 | 6 mo | 8.0–23.0 (95% CIs NR) |
| Silva 2004 [46] | Mod | 3,182 | Point | 4.2 (3.5–4.9) | SHP 1999–2000 [89, 90] | Mod | 7,799 | 12 mo | 34.2 (33.1–35.3) |
| Mendoza-Sassi 2006 [47] | Mod | 1,259 | 2 mo | 35.1 (32.5–37.7) | Santos-Eggimann 2000 [91] | Mod | 3,227 | 12 mo | 9.5–38.5 (5.4–48.0)b |
| Blay 2007 [48] | Mod | 6,961 | 6 mo | 43.2 (41.9–44.3) | SHP 2000–2001 [89, 90] | Mod | 7,073 | 12 mo | 38.7 (37.6–39.8) |
| De Vitta 2011 [49] | Low | 1,236 | 12 mo | 19.5 (17.3–21.7) | SHP 2001–2002 [89, 90] | Mod | 6,601 | 12 mo | 38.4 (37.2–39.6) |
| Ferreira 2011 [50] | Low | 972 | 12 mo | 40.0 (36.9–43.2) | HBSC 2002 [59, 92] | Mod | 9,275 | 6 mo | 38.6 (37.2–40.0) |
| Onofrio 2012 [51] | Low | 1,233 | 1 mo | 13.7 (11.8–15.6) | SHP 2002–2003 [89, 90] | Mod | 5,700 | 12 mo | 37.8 (36.5–39.1) |
| Meziat Filho 2015 [52] | High | 1,102 | 1 mo | 28.6 (25.9–31.2) | SHP 2003–2004 [89, 90] | Mod | 5,220 | 12 mo | 35.8 (34.5–37.1) |
| Depintor 2016 [53] | Low | 826 | 1 mo | 18.4 (15.8–21.2) | SHP 2004–2005 [89, 90] | Mod | 8,065 | 4 wk | 44.8 (43.7–45.9) |
| Noll 2016 [54] | Mod | 1,597 | 3 mo | 55.7 (53.1–58.3) | HBSC 2006 [92, 62, 93] | Mod | 9,507 | 6 mo | 42.4 (41.0–43.8) |
| LBP — Canada | SHP 2006–2007 [89, 90] | Mod | 6,657 | 4 wk | 44.7 (43.5–45.9) | ||||
| Liira 1996 [55] | Mod | 38,540 | Point | 7.8 (7.2–8.4) | SHP 2007–2008 [89, 90] | Mod | 6,979 | 4 wk | 45.3 (44.1–46.5) |
| HBSC 1997–1998 [56, 57] | Mod | 6,215 | 6 mo | 49.7 (47.9–51.5) | SHP 2008–2009 [89, 90] | Mod | 6,903 | 4 wk | 44.8 (43.6–46.0) |
| Cassidy 1998 [58] | Low | 1,131 | Point | 28.7 (26.1–31.4) | Pellisé 2009 [23] | Low | 1,470 | 1 mo | 39.8 (36.3–43.3) |
| HBSC 2002 [59, 60] | Mod | 4,458 | 6 mo | 41.2 (39.2–43.2) | HBSC 2010 [92, 64, 94] | Mod | 9,886 | 6 mo | 41.8 (40.4–43.2) |
| Currie 2004 [61] | Mod | 118,533 | 12 mo | 8.9 (8.7–9.1) | Erne 2011 [95] | Mod | 189 | 1 mo | 13.8 (6.8–20.8) |
| HBSC 2005 [62, 63] | Mod | 9,670 | 6 mo | 46.6 (45.2–48.0) | Kolb 2011 [96] | Mod | 3,881 | 12 mo | 33.2 (31.7–34.7) |
| HBSC 2010 [64, 65] | Mod | 26,078 | 6 mo | 44.0 (43.1–44.9) | Balagué 2012 [24] | Low | 1,470 | 1 mo | 39.8 (36.3–43.3) |
| LBP — Spain | NP — Brazil | ||||||||
| Ballina García 1994 [66] | Mod | 702 | 12 mo | 28.2 (23.9–31.0) | Genebra 2017 [97] | Low | 600 | 12 mo | 20.3 (17.3–23.7) |
| Carmona 2001 [25, 67] | Low | 2,192 | Point | 14.8 (12.2–17.4) | NP — Spain | ||||
| Català 2002 [68] | Mod | 5,000 | Point | 11.9 (10.6–13.2) | Jiménez Sánchez 2012 [26, 81] | Mod | 12,190 | 12 mo | 6.0 (5.6–6.4) |
| HBSC 2002 [59, 69] | Mod | 13,552 | 6 mo | 42.5 (41.3–43.7) | Knee OA — Canada | ||||
| WHS 2002–2003 [70] | Mod | 6,275 | 1 mo | 35.1 (33.4–36.8) | Plotnikoff 2015 [98, 99] | Mod | 4,733 | Point | 10.5 (9.3–11.7) |
| HBSC 2006 [62, 71] | Mod | 21,811 | 6 mo | 38.6 (37.7–39.5) | Knee OA — Spain | ||||
| Pinto Meza 2006 [72] | Mod | 2,121 | 12 mo | 14.7 (12.3–17.1) | Carmona 2001 [25, 67] | Low | 2,192 | 1 mo | 10.2 (8.5–11.9) |
| Demyttenaere 2007 [73, 74] | Low | 2,121 | 12 mo | 14.7 (12.6–16.8) | Fernández López 2008 [100] | Low | 2,192 | 1 mo | 10.2 (7.9–12.5) |
Summary characteristics of primary data input studies informing Global Burden of Disease Study 2019 modelled epidemiologic estimates of low back pain, neck pain, and knee osteoarthritis in Australia, Brazil, Canada, Spain, and Switzerland, 1990–2019.a
There were no primary data input studies for neck pain from Australia, Canada, and Switzerland, as well as no primary data input studies for knee OA from Australia, Brazil, and Switzerland. Prevalence estimates are reported as point estimates with 95% CIs.
Range of strata-specific prevalence estimates and confidence intervals for different age groups and genders; overall total prevalence estimate not reported.
CI, confidence interval; HBSC, Health Behaviour in School-aged Children; LBP, low back pain; mo, months; Mod, moderate; N, study size; NHS, National Health Survey; NP, neck pain; NR, not reported; OA, osteoarthritis; Period, prevalence period; RoB, overall study risk of bias; SDAC, Survey of Disability, Ageing and Carers; SHP, Swiss Household Panel; WHS, World Health Survey; wk, weeks.
FIGURE 1
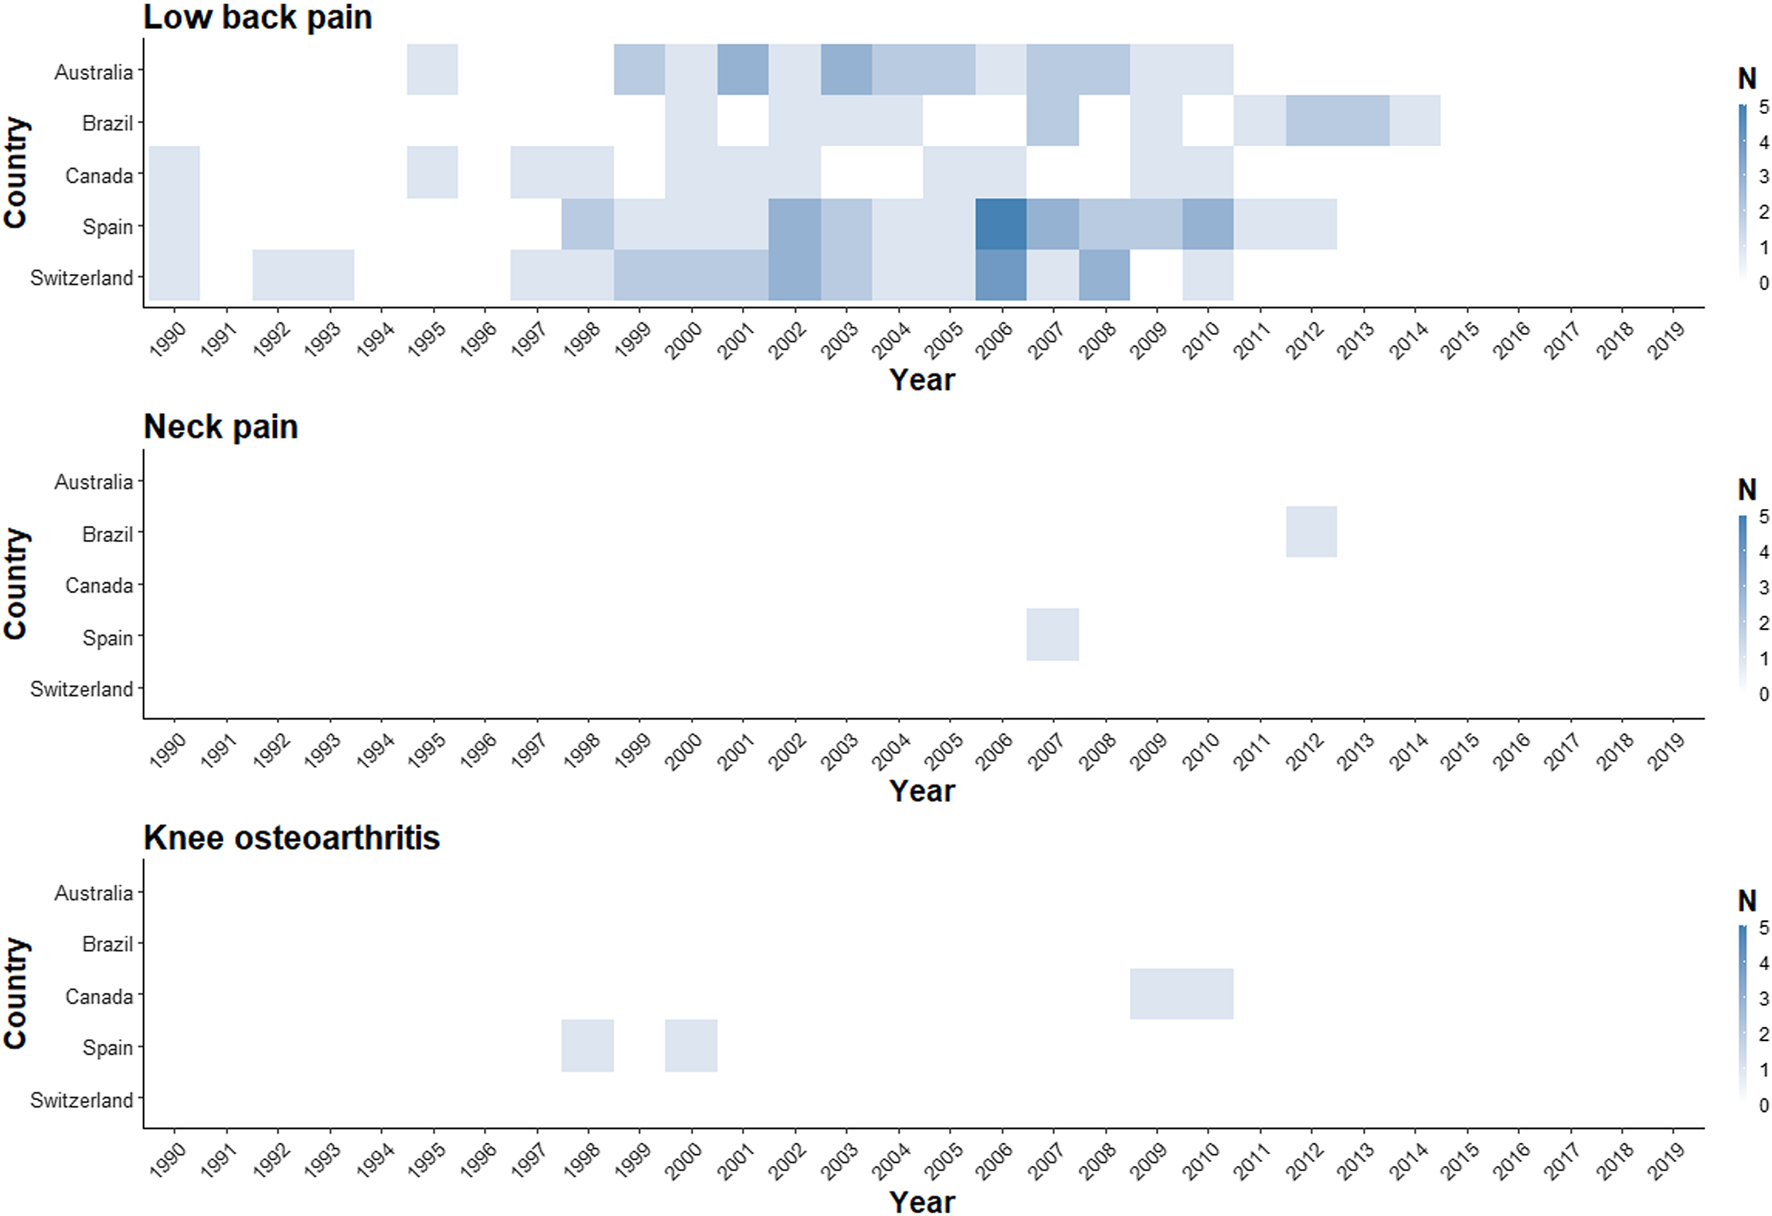
Number of low back pain, neck pain, and knee osteoarthritis primary input studies informing year-specific modelled prevalence estimates (Global Burden of Disease Study 2019—Australia, Brazil, Canada, Spain, and Switzerland [1990 to 2019]).
Characteristics of Primary Input Studies
Table 1 summarises key characteristics of the primary input studies. The included studies had between 189 and 118,533 participants, with most studies (61 of 67) having more than 1,000 participants. There were variations in the sampling frame of studies for LBP (see detailed evidence table in Supplementary Datasheet S1 pp 13–32), with more than a third of them (25 of 67) having a subnational focus. Most studies for LBP used stratified, clustered, or a multistage combination of probabilistic sampling approaches, although 9 of 67 did not specify the strategy. The proportion of respondents was adequate for most studies, although 2 of 67 did not reach a 50% response proportion. The variability of LBP case definitions was striking, with different recall periods, chronicity, anatomical pain locations, and activity-limiting considerations. Primary data prevalence estimates varied considerably between studies and countries.
The two primary data input studies for NP included subnational sampling frames and used probabilistic multistage sampling (detailed evidence table in Supplementary Datasheet S1 p 33) [26, 97]. However, these two studies differed substantially in their sample size (12,190 participants vs. 600) and proportion of respondents (38% vs. 94%). They also differed in their case definitions, since one study did not indicate the anatomical location of the neck and asked participants for medical confirmation [26], while the other specified the anatomical location between the occiput and the third thoracic vertebra and used a validated tool [97]. Their NP one-year period prevalence estimates also varied substantially (Table 1; Supplementary Datasheet S1 p 33).
Two of the three primary studies for knee OA included national samples and used stratified multistage cluster sampling [25, 100], while the remaining study included a national sample but used a random digit dial strategy (detailed evidence table in Supplementary Datasheet S1 p 34) [98]. Differences were observed in response proportions, prevalence periods, and case definitions. The prevalence of knee OA was similar in the three studies (Table 1; Supplementary Datasheet S1 p 34).
Risk of Bias of Primary Input Studies
The main criteria items in Hoy’s tool to introduce bias in primary studies (items 1, 6, and 7) corresponded to target populations not representing national populations in terms of key demographic characteristics (limited generalizability: 30 of 72 studies), suboptimal case definitions (no anatomical location specification: 49 of 72 studies), and the use of study instruments without demonstrated reliability or validity (prone to misclassification: 47 of 72 studies). Based on the overall summary rating, 48 of 72 studies were rated as moderate risk of bias, suggesting that further research may have an important impact on the confidence placed in their observed prevalence estimates (Supplementary Datasheet S1 pp 35–42).
Certainty of GBD Modelled Prevalence Estimates—GRADE Assessment
With all modelled prevalence estimates (Figure 2; Supplementary Datasheet S1 pp 43–48) starting by default at “high certainty,” we downgraded them two levels for risk of bias, which made them transition to “low certainty” (Table 2). This downgrade was justified due to concerns about the structure of the models and the lack of certainty of evidence in each of their model inputs. In countries without identifiable primary input studies, we downgraded modelled prevalence estimates one certainty level due to indirectness of model inputs with respect to the model. Having found significant unexplained variability in modelled LBP prevalence outputs in Switzerland between 2016 and 2019 and NP prevalence outputs in Spain between 2001 and 2014, we downgraded one additional certainty level due to inconsistency in these two cases. We did not downgrade modelled estimates for imprecision since uncertainty intervals around point estimates were judged to be precise, regardless of the amount of primary input studies. Taken together, the certainty of modelled LBP, NP, and knee OA prevalence estimates in Australia, Brazil, Canada, Spain, and Switzerland ranged between very low and low, with greater certainty found for LBP (Table 2; see detailed GRADE rating explanations in Supplementary Datasheet S1 pp 49–54).
FIGURE 2
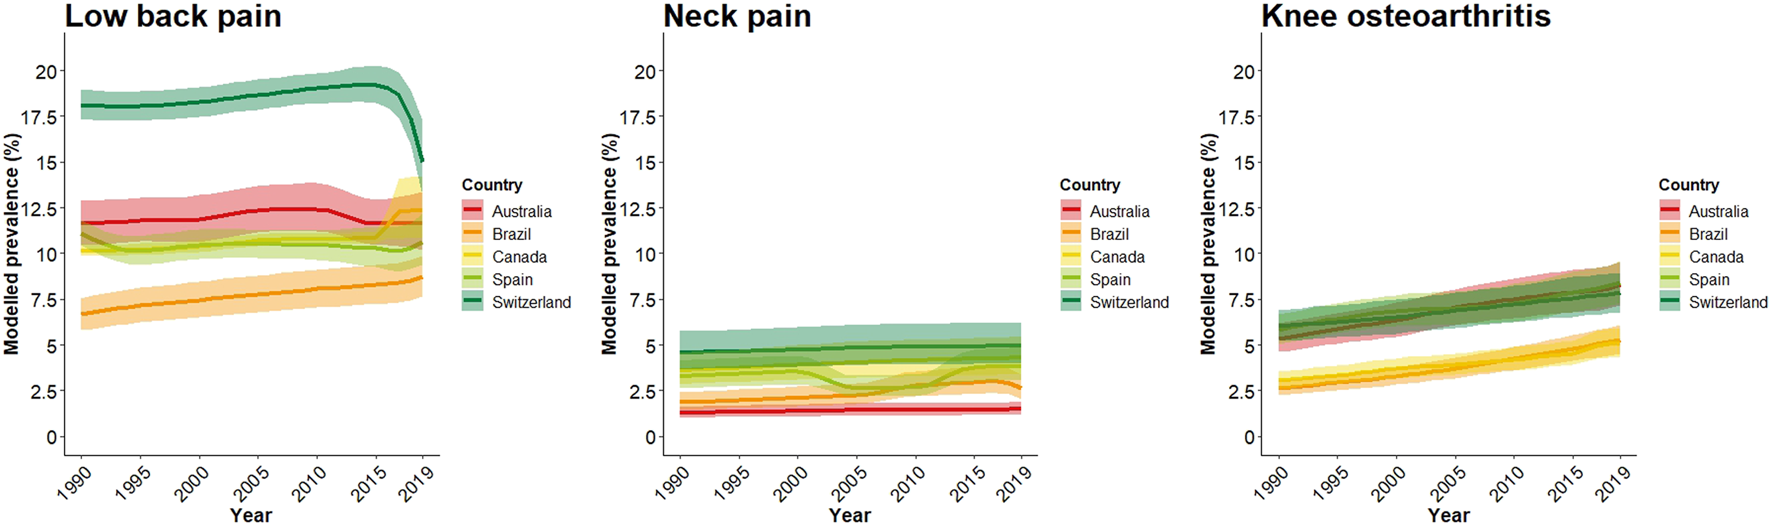
Modelled prevalence trends with 95% uncertainty intervals for low back pain, neck pain, and knee osteoarthritis (Global Burden of Disease Study 2019–Australia, Brazil, Canada, Spain, and Switzerland [1990 to 2019]).
TABLE 2
| Country Condition | GRADE criteria | Range of modelled prevalence (95% UI) | Overall certainty | |||
|---|---|---|---|---|---|---|
| Risk of bias | Inconsistency | Indirectness | Imprecision | |||
| Australia | ||||||
| LBP | Very serious ↓↓ | Not serious | Not serious | Not serious | 11.6 to 12.4 (10.2–13.9) | Lowa,b ⊕⊕○○ |
| NP | Very serious ↓↓ | Not serious | Serious ↓ | Not serious | 1.3 to 1.5 (1.0–1.9) | Very lowa,b,c⊕○○○ |
| Knee OA | Very serious ↓↓ | Not serious | Serious ↓ | Not serious | 5.4 to 8.3 (4.6–9.5) | Very lowa,b,c⊕○○○ |
| Brazil | ||||||
| LBP | Very serious ↓↓ | Not serious | Not serious | Not serious | 6.7 to 8.7 (5.8–9.9) | Lowa,b ⊕⊕○○ |
| NP | Very serious ↓↓ | Not serious | Not serious | Not serious | 1.9 to 3.0 (1.5–3.9) | Lowa,b,c ⊕⊕○○ |
| Knee OA | Very serious ↓↓ | Not serious | Serious ↓ | Not serious | 2.7 to 5.4 (2.3–6.1) | Very lowa,b,c⊕○○○ |
| Canada | ||||||
| LBP | Very serious ↓↓ | Not serious | Not serious | Not serious | 10.1 to 12.4 (9.8–14.2) | Lowa,b ⊕⊕○○ |
| NP | Very serious ↓↓ | Not serious | Serious ↓ | Not serious | 3.6 to 4.3 (2.9–5.4) | Very lowa,b,c⊕○○○ |
| Knee OA | Very serious ↓↓ | Not serious | Not serious | Not serious | 3.0 to 5.1 (2.6–5.9) | Lowa,b ⊕⊕○○ |
| Spain | ||||||
| LBP | Very serious ↓↓ | Not serious | Not serious | Not serious | 10.1 to 11.1 (9.0–12.2) | Lowa,b ⊕⊕○○ |
| NP | Very serious ↓↓ | Serious ↓ | Not serious | Not serious | 2.6 to 3.9 (2.2–4.8) | Very lowa,b,d⊕○○○ |
| Knee OA | Very serious ↓↓ | Not serious | Not serious | Not serious | 5.8 to 8.4 (5.0–9.6) | Lowa,b ⊕⊕○○ |
| Switzerland | ||||||
| LBP | Very serious ↓↓ | Serious ↓ | Not serious | Not serious | 15.0 to 19.2 (13.1–20.3) | Very lowa,b,d⊕○○○ |
| NP | Very serious ↓↓ | Not serious | Serious ↓ | Not serious | 4.6 to 4.9 (3.7–6.2) | Very lowa,b,c⊕○○○ |
| Knee OA | Very serious ↓↓ | Not serious | Serious ↓ | Not serious | 6.0 to 7.9 (5.2–8.9) | Very low ⊕○○○ |
Summary certainty assessment for modelled prevalence estimates of low back pain, neck pain, and knee osteoarthritis following Grading of Recommendations, Assessment, Development and Evaluation guidelines 30 (Global Burden of Disease Study 2019–Australia, Brazil, Canada, Spain, and Switzerland [1990 to 2019]).
Downgraded −1 for risk of bias, due to concerns about the credibility of the model, influenced by its conceptualisation and structure.
Downgraded −1 for risk of bias, due to concerns about the certainty and exhaustiveness of model inputs.
Downgraded −1 for indirectness, due to indirectness of model inputs with respect to the model, influenced by lack of primary data input studies.
Downgraded −1 for inconsistency, due to unexplained variability in modelled outputs.
Discussion
Statement of Findings
The analysed GBD 2019 primary data input studies for LBP, NP, and knee OA in our meta-epidemiological study had methodological shortcomings and had low coverage for the studied period. Similarly, the certainty of modelled prevalence estimates of LBP, NP, and knee OA in Australia, Brazil, Canada, Spain, and Switzerland ranged between very low and low.
Meaning and Importance of Findings
Primary data input studies had limitations mainly related to their representativeness, case definitions, and validity of their instruments to measure prevalence. Although we used an inclusive prevalence period recall of up to 1 year as acceptable in assessing case definitions, recall periods of more than 4 weeks might be prone to memory bias [101]. Furthermore, between 1990 and 2019 there were a substantial number of years without any primary study coverage, which might compromise temporal interpolations of modelled estimates. Our findings indicate that GBD modelled prevalence estimates should be interpreted with caution and acknowledge inherent weaknesses of primary input studies and sources of uncertainty of the modelling process. Our approach also conceivably supports the feasibility of establishing methodological approaches to rate the certainty of GBD metrics.
An interesting result to emerge from the GRADE application, was the observed consistency and precision of modelled prevalence estimates. The direction and width of modelled prevalence uncertainty intervals were not sensitive to the number of primary input studies for a given country. This observation, which is in agreement with a recent correspondence to a GBD analysis in Iran [102, 103], potentially highlights that modelling assumptions, country-specific covariates, and alternative primary data may also influence modelled estimates. Major advances are occurring in terms of GBD best reporting practice and Burden of Proof methodology [12, 104]. Unlike our proposed GRADE approach for certainty of modelled prevalence estimates, Burden of Proof focuses on risk-outcome relationships, aggregates evidence across multiple studies, and enables a quantitative comparison of risk-outcome pairs, ultimately assessing the strength of evidence with an intuitive star rating. Future results of evaluations of GBD modelling performance, sensitivity analyses, and star ratings to summarise evidence beyond risk-outcome pairs will continue to advance this body of knowledge.
In our study, two exceptions to the consistency of GBD modelled estimates were observed (Figure 2). First, LBP modelled prevalence trends in Switzerland between 2016 and 2019, decreased from 19.1% (95% UI, 18.0%–20.2%) to 15.0% (13.1%–17.2%), a change that was not observed in other countries. Second, NP modelled prevalence trends in Spain between 2001 and 2014 decreased from 3.5% (95% UI: 2.8%–4.3%) in 2001 to 2.6% (2.2%–3.3%) in 2005 and then increased to 3.7% (2.9%–4.6%) in 2014, creating a U-shape trend line. Importantly, these variations in modelled prevalence estimates could not be unambiguously explained by any of the primary data input studies (primary input studies for Switzerland, 2016–2019: 0 studies; primary data input studies for Spain, 2001–2014: 1 study).
Our Findings in the Context of Existing Evidence
Our results expand on those reported by Tamrakar et al., who explored primary data input studies for LBP in GBD 2017 [11], examining more countries and using an alternative approach to rate the completeness and quality of primary input studies. Brhlikova et al. also assessed the quality of primary studies for depression in GBD 2000, pointing out their limitations [105]. Our study adds to the existing body of knowledge by applying a novel GRADE approach to rate the certainty of GBD modelled prevalence estimates, aiming to improve the assessment and communication of uncertainty. This addition is relevant for GBD, as there are national burden of disease initiatives that have developed certainty frameworks based on the availability and transformation applied to primary data [106, 107].
Alternative Explanation and Challenges of GRADE
Despite our analysis, primary data input studies were not the unique source of input for GBD 2019. Access and evaluation of opportunistic surveys and claims data may have resulted in alternative findings. Additionally, we did not have enough information to fully assess all dimensions of credibility of the model, to judge the input parameters to which modelled prevalence estimates were sensitive, nor to assess the potential impact of studies that were excluded from the GBD 2019 systematic reviews. We also encountered challenges in the application of GRADE Guidelines 30—although options to incorporate multiple model outputs in decision-making are available, we used an existing model without adaptation due to resource limitations. Adapting the GBD model would have required all input data relevant for prevalence estimation, GBD modelling expertise, and extensive computational resources.
Strengths and Limitations
The abundance of secondary analyses of GBD MSK data contrasts with a paucity of methodological publications [108–110], and a scarcity of analytical approaches to facilitate the interpretation of modelled estimates. Among the strengths of our study, the use of a validated tool to assess risk of bias of primary input studies and a well-established framework to assess the certainty of modelled evidence should be highlighted. In addition, choosing prevalence estimates could also be considered a strength, since these are not affected by disability weights, severity distributions, or comorbidity corrections, requiring fewer dimensions to judge their certainty. The exclusion of disability weight-based metrics adds pragmatism since there are potential biases in weighted average disability weights created using worldwide factors [111], and inter-country variations in the subjective valuation of health states are expected [108].
Our study has several limitations. First, we purposively explored a select number of MSK conditions and countries. That said, GBD primary data have better coverage and lower risk of bias for countries with higher incomes [11], suggesting that our risk of bias and certainty findings may approximate a best case scenario. Second, we restricted our analysis to primary data input studies identifiable in the GBD 2019 Data Input Sources Input Tool and did not include other sources of GBD input data. Third, we did not analyse neighbouring countries, even though GBD uses them for modelling estimation. Fourth, we excluded the category of “other MSK disorders”, despite its high modelled prevalence, due to its heterogeneity. Fifth, although some studies for a newer GBD have been published [112], we did not have access to up-to-date primary input studies. Sixth, the validity of GRADE for assessing the certainty of modelled GBD prevalence estimates is unknown and other conceptual frameworks may be more suitable [113]. The possibility that alternative assessment approaches would have yielded different certainty findings cannot be ruled out.
Suggestions for Future Research
Along with progress in the estimation of prevalence in GBD, it is crucial to encourage high-quality primary data on risk factors and advance methods to obtain accurate, time-varying MSK severity distributions by triangulation of data sources across locations [114]. This importance is accentuated given the marked contribution of MSK disorders to YLD, their wide range of severity weights across health states, and the plausible exacerbation of MSK severity within the context of the COVID pandemic. An important issue to strengthen population-based MSK research is to promote the use of optimal case definitions (including activity limiting considerations, explicit anatomical location, duration, and appropriate prevalence periods of maximum 4 weeks to minimize memory bias) [101], as well as the use of validated tools to measure prevalence. Collaborative networks, such as the European Burden of Disease Network, may be a promising driver of improvement in supporting methodological advances [115]. Additional studies may elucidate the optimal approach to rate the certainty of GBD estimates. Advancement in this area could help GBD end-users, some of whom lack technical ability to comprehend complex models and may be pressured to make policy decisions. The combination of the GBD premise that “providing estimates with corresponding uncertainty is better than not providing any estimate at all” [116], and the suggested poor legitimization of MSK disorders at times [117], calls for crucial advances in understanding the true burden of MSK conditions.
Conclusion
The primary data input studies that underpinned the GBD 2019 prevalence estimates of LBP, NP, and knee OA in Australia, Brazil, Canada, Spain, and Switzerland had methodological shortcomings. This meta-epidemiological work also suggests that the certainty of GBD modelled prevalence estimates for these three MSK pain conditions is limited mainly due to risk of bias and indirectness. Future primary input studies with lower risk of bias, and the optimal assessment of uncertainty in modelled outputs, will likely improve the certainty of modelled prevalence estimates.
Statements
Data availability statement
Datasets and primary data input studies are publicly available. These data can be found at: https://ghdx.healthdata.org/gbd-2019/data-input-sources, https://vizhub.healthdata.org/gbd-results/.
Author contributions
CAH and JML had full access to the data and take responsibility for data integrity and accuracy of data analysis. CAH, JML, and MAP conceived the study and obtained funding. CAH was the principal investigator. CAH, FRA, and MAP provided study resources and supervision. All authors participated in the design and conduct of the study. JML led the statistical analysis with input from CAH and MAP. JML produced the first draft of the manuscript. All authors contributed to the writing and approval of the final manuscript. CAH had final responsibility for the decision to submit for publication. All authors had full access to all the data in the study and approved the decision to submit for publication.
Funding
This work was supported, in part, by the European Cooperation in Science and Technology (COST Action CA18218 virtual mobility grant No CA18218-6a68cbf4). The funder had no role in study conceptualisation and design, or in the collection, analysis, interpretation of data, writing of the report, or decision to submit the manuscript for publication.
Acknowledgments
We would like to acknowledge the networking support from COST Action CA18218 (European Burden of Disease Network; www.burden-eu.net), supported by COST (European Cooperation in Science and Technology; www.cost.eu). We also thank Dr. Miquel Serra-Burriel for his thoughtful review and comments on the manuscript.
Conflict of interest
JML, CAH, RDP, and BD report support for attending a meeting of the European Cooperation in Science and Technology – COST Action CA18218 (European Burden of Disease Network). JML, CAH, RDP, JVS, GMAW, and BD are members of the European COST Action CA18218. CAH and MAP report grants from the Swiss National Science Foundation (SNSF) and the European Centre for Chiropractic Research Excellence (ECCRE) outside the submitted work.
The remaining author declares that they do not have any conflicts of interest.
Supplementary material
The Supplementary Material for this article can be found online at: https://www.ssph-journal.org/articles/10.3389/ijph.2023.1605763/full#supplementary-material
References
1.
Vos T Lim SS Abbafati C Abbas KM Abbasi M Abbasifard M et al Global burden of 369 Diseases and Injuries in 204 Countries and Territories, 1990–2019: a Systematic Analysis for the Global Burden of Disease Study 2019. Lancet (2020) 396(10258):1204–22. 10.1016/S0140-6736(20)30925-9
2.
Hoy D Bain C Williams G March L Brooks P Blyth F et al A Systematic Review of the Global Prevalence of Low Back Pain. Arthritis Rheum (2012) 64(6):2028–37. 10.1002/art.34347
3.
Hoy DG Protani M De R Buchbinder R . The Epidemiology of Neck Pain. Best Pract Res Clin Rheumatol (2010) 24(6):783–92. 10.1016/j.berh.2011.01.019
4.
Johnson VL Hunter DJ . The Epidemiology of Osteoarthritis. Best Pract Res Clin Rheumatol (2014) 28(1):5–15. 10.1016/j.berh.2014.01.004
5.
Briggs AM Woolf AD Dreinhöfer K Homb N Hoy DG Kopansky-Giles D et al Reducing the Global burden of Musculoskeletal Conditions. Bull World Health Organ (2018) 96(5):366–8. 10.2471/BLT.17.204891
6.
Cieza A Causey K Kamenov K Hanson SW Chatterji S Vos T . Global Estimates of the Need for Rehabilitation Based on the Global Burden of Disease Study 2019: a Systematic Analysis for the Global Burden of Disease Study 2019. Lancet (2020) 396(10267):2006–17. 10.1016/S0140-6736(20)32340-0
7.
Hartvigsen J Hancock MJ Kongsted A Louw Q Ferreira ML Genevay S et al What Low Back Pain Is and Why We Need to Pay Attention. Lancet (2018) 391(10137):2356–67. 10.1016/S0140-6736(18)30480-X
8.
Maher C Ferreira G . Time to Reconsider what Global Burden of Disease Studies Really Tell Us about Low Back Pain. Ann Rheum Dis (2022) 81(3):306–8. 10.1136/annrheumdis-2021-221173
9.
Hincapié CA Muñoz Laguna J . Letter to the editor concerning “Epidemiological trends of low back pain at the global, regional, and national levels” by L. Wang et al. (Eur Spine J [2022]; 10.1007/s00586-022-07133-x). Eur Spine J (2022). 10.1007/s00586-022-07209-8
10.
Ferreira GE Buchbinder R Zadro JR O’Keeffe M Kharel P Carballo-Costa L et al Are Musculoskeletal Conditions Neglected in National Health Surveys? Rheumatology (2021) 60(10):4874–9. 10.1093/rheumatology/keab025
11.
Tamrakar M Kharel P Traeger A Maher C O’Keeffe M Ferreira G . Completeness and Quality of Low Back Pain Prevalence Data in the Global Burden of Disease Study 2017. BMJ Glob Health (2021) 6(5):e005847. 10.1136/bmjgh-2021-005847
12.
Zheng P Afshin A Biryukov S Bisignano C Brauer M Bryazka D et al The Burden of Proof Studies: Assessing the Evidence of Risk. Nat Med (2022) 28(10):2038–44. 10.1038/s41591-022-01973-2
13.
Guyatt G Oxman AD Sultan S Brozek J Glasziou P Alonso-Coello P et al GRADE Guidelines: 11. Making an Overall Rating of Confidence in Effect Estimates for a Single Outcome and for All Outcomes. J Clin Epidemiol (2013) 66(2):151–7. 10.1016/j.jclinepi.2012.01.006
14.
Puhan MA Schünemann HJ Murad MH Li T Brignardello-Petersen R Singh JA et al A GRADE Working Group Approach for Rating the Quality of Treatment Effect Estimates from Network Meta-Analysis. BMJ (2014) 349:g5630. 10.1136/bmj.g5630
15.
Brozek JL Canelo-Aybar C Akl EA Bowen JM Bucher J Chiu WA et al GRADE Guidelines 30: the GRADE Approach to Assessing the Certainty of Modeled Evidence—An Overview in the Context of Health Decision-Making. J Clin Epidemiol (2021) 129:138–50. 10.1016/j.jclinepi.2020.09.018
16.
Egger M Johnson L Althaus C Schöni A Salanti G Low N et al Developing WHO Guidelines: Time to Formally Include Evidence from Mathematical Modelling Studies. F1000Res (2017) 6:1584. 10.12688/f1000research.12367.2
17.
Murad MH Wang Z . Guidelines for Reporting Meta-Epidemiological Methodology Research. BMJ Evid-based Med (2017) 22(4):139–42. 10.1136/ebmed-2017-110713
18.
Muñoz Laguna J Rodríguez Artalejo F Puhan MA Pauw RD Wyper GMA Devleesschauwer B et al Development and Application of an Approach to Rate the Quality of Global Burden of Disease Study 2019 Prevalence Estimates for Three Musculoskeletal Conditions: A Protocol (2022). 10.17605/OSF.IO/JUB9P
19.
Hoy D Brooks P Woolf A Blyth F March L Bain C et al Assessing Risk of Bias in Prevalence Studies: Modification of an Existing Tool and Evidence of Interrater Agreement. J Clin Epidemiol (2012) 65(9):934–9. 10.1016/j.jclinepi.2011.11.014
20.
Hoy D March L Woolf A Blyth F Brooks P Smith E et al The Global burden of Neck Pain: Estimates from the Global Burden of Disease 2010 Study. Ann Rheum Dis (2014) 73(7):1309–15. 10.1136/annrheumdis-2013-204431
21.
Cui A Li H Wang D Zhong J Chen Y Lu H . Global, Regional Prevalence, Incidence and Risk Factors of Knee Osteoarthritis in Population-Based Studies. EClinicalMedicine (2020) 29–30:100587. 10.1016/j.eclinm.2020.100587
22.
McGuinness LA Higgins JPT . Risk-of-bias VISualization (Robvis): An R Package and Shiny Web App for Visualizing Risk-Of-Bias Assessments. Res Synth Methods (2021) 12(1):55–61. 10.1002/jrsm.1411
23.
Pellisé F Balagué F Rajmil L Cedraschi C Aguirre M Fontecha CG et al Prevalence of Low Back Pain and its Effect on Health-Related Quality of Life in Adolescents. Arch Pediatr Adolesc Med (2009) 163(1):65–71. 10.1001/archpediatrics.2008.512
24.
Balagué F Ferrer M Rajmil L Pont Acuña A Pellisé F Cedraschi C . Assessing the Association between Low Back Pain, Quality of Life, and Life Events as Reported by Schoolchildren in a Population-Based Study. Eur J Pediatr (2012) 171(3):507–14. 10.1007/s00431-011-1596-1
25.
Carmona L Ballina J Gabriel R Laffon A EPISER Study Group. The burden of Musculoskeletal Diseases in the General Population of Spain: Results from a National Survey. Ann Rheum Dis (2001) 60(11):1040–5. 10.1136/ard.60.11.1040
26.
Jiménez-Sánchez S Fernández-de-Las-Peñas C Carrasco-Garrido P Hernández-Barrera V Alonso-Blanco C Palacios-Ceña D et al Prevalence of Chronic Head, Neck and Low Back Pain and Associated Factors in Women Residing in the Autonomous Region of Madrid (Spain). Gac Sanit (2012) 26(6):534–40. 10.1016/j.gaceta.2011.10.012
27.
McLennan W . National Health Survey. User’s Guide. Cat. No. 4363.0. Canberra: Australian Bureau of Statistics (1995).
28.
National Health Survey. Summary of Results. Cat. No. 4364.0. Canberra: Australian Bureau of Statistics (1995).
29.
National Health Survey. User’s Guide. Cat. No. 4363.0.55.001. Canberra: Australian Bureau of Statistics (2001).
30.
National Health Survey. Summary of Results. Cat. No. 4364.0. Canberra: Australian Bureau of Statistics (2001).
31.
Trewin D . Survey of Disability, Ageing and Carers. Users’ Guide. Cat. No. 4431.0.55.001. Canberra: Australian Bureau of Statistics (2003).
32.
Survey of Disabilit. Ageing and Carers. Summary of Findings. Cat. No. 4430.0. Canberra: Australian Bureau of Statistics (2003).
33.
World Health Organization. World Health Survey. Geneva, Switzerland: World Health Organization (2003). Report of Australia.
34.
Walker BF Muller R Grant WD . Low Back Pain in Australian Adults. Prevalence and Associated Disability. J Manipulative Physiol Ther (2004) 27(4):238–44. 10.1016/j.jmpt.2004.02.002
35.
National Health Survey. User’s Guide. Cat. No. 4363.0.55.001. Canberra: Australian Bureau of Statistics (2004-2005).
36.
National Health Survey. Summary of Results. Cat. No. 4364.0. Canberra: Australian Bureau of Statistics (2004-2005).
37.
Grimmer K Nyland L Milanese S . Longitudinal Investigation of Low Back Pain in Australian Adolescents: a Five-Year Study. Physiother Res Int (2006) 11(3):161–72. 10.1002/pri.340
38.
National Health Survey. User’s Guide. Cat. No. 4363.0.55.001. Canberra: Australian Bureau of Statistics (2007-2008).
39.
National Health Survey. Summary of Results. Cat. No. 4364.0. Canberra: Australian Bureau of Statistics (2007-2008). (Reissue).
40.
Pink B . Survey of Disability, Ageing and Carers. Users’ Guide. Cat. No. 4431.0.55.001. Canberra: Australian Bureau of Statistics (2009).
41.
Survey of Disability, Ageing and Carers. Summary of Findings. Cat. No. 4431.0.55.001. Canberra: Australian Bureau of Statistics (2009).
42.
Ramelow D Griebler R Hofmann F Unterweger K Mager U Felder-Puig R et al Gesundheit und Gesundheitsverhalten von österreichischen Schülern und Schülerinnen Ergebnisse des WHO-HBSC-Survey 2010. Bundesministerium für Gesundheit, Sekt. III. [Internet] (2011). Available from: http://www.hbsc.org/membership/countries/austria.html (Accessed June 5, 2022).
43.
Broom AF Kirby ER Sibbritt DW Adams J Refshauge KM . Back Pain Amongst Mid-age Australian Women: a Longitudinal Analysis of Provider Use and Self-Prescribed Treatments. Complement Ther Med (2012) 20(5):275–82. 10.1016/j.ctim.2012.05.003
44.
O’Sullivan PB Beales DJ Smith AJ Straker LM . Low Back Pain in 17 Year Olds Has Substantial Impact and Represents an Important Public Health Disorder: a Cross-Sectional Study. BMC Public Health (2012) 12(1):100. 10.1186/1471-2458-12-100
45.
World Health Organization. World Health Survey 2003. Geneva, Switzerland: World Health Organization (2003). Report of Brazil.
46.
Silva MC Fassa AG Valle NCJ . Chronic Low Back Pain in a Southern Brazilian Adult Population: Prevalence and Associated Factors. Cad Saude Publica (2004) 20(2):377–85. 10.1590/s0102-311x2004000200005
47.
Mendoza-Sassi R Béria JU Fiori N Bortolotto A . Prevalence of Signs and Symptoms, Associated Sociodemographic Factors and Resulting Actions in an Urban center in Southern Brazil. Pan Am J Public Health (2006) 20(1):22–8. 10.1590/s1020-49892006000700003
48.
Blay SL Andreoli SB Dewey ME Gastal FL . Co-occurrence of Chronic Physical Pain and Psychiatric Morbidity in a Community Sample of Older People. Int J Geriatr Psychiatry (2007) 22(9):902–8. 10.1002/gps.1761
49.
De Vitta A Martinez MG Piza NT Simeão SFde AP Ferreira NP . Prevalence of Lower Back Pain and Associated Factors in Students. Cad Saude Publica (2011) 27(8):1520–8. 10.1590/s0102-311x2011000800007
50.
Ferreira GD Silva MC Rombaldi AJ Wrege ED Siqueira FV Hallal PC . Prevalência de dor nas costas e fatores associados em adultos Do sul Do Brasil: estudo de base populacional. Rev Bras Fisioter (2011) 15(1):31–6. 10.1590/s1413-35552011005000001
51.
Onofrio AC da Silva MC Domingues MR Rombaldi AJ . Acute Low Back Pain in High School Adolescents in Southern Brazil: Prevalence and Associated Factors. Eur Spine J (2012) 21(7):1234–40. 10.1007/s00586-011-2056-3
52.
Meziat Filho N Coutinho ES Azevedo e Silva G . Association between home Posture Habits and Low Back Pain in High School Adolescents. Eur Spine J (2015) 24(3):425–33. 10.1007/s00586-014-3571-9
53.
Depintor JDP Bracher ESB Cabral DMC Eluf-Neto J . Prevalence of Chronic Spinal Pain and Identification of Associated Factors in a Sample of the Population of São Paulo, Brazil: Cross-Sectional Study. Sao Paulo Med J (2016) 134(5):375–84. 10.1590/1516-3180.2016.0091310516
54.
Noll M Candotti CT Rosa BNda Loss JF . Back Pain Prevalence and Associated Factors in Children and Adolescents: an Epidemiological Population Study. Rev Saude Publica (2016) 50:31. 10.1590/S1518-8787.2016050006175
55.
Liira JP Shannon HS Chambers LW Haines TA . Long-term Back Problems and Physical Work Exposures in the 1990 Ontario Health Survey. Am J Public Health (1996) 86(3):382–7. 10.2105/ajph.86.3.382
56.
Currie C Hurrelmann K Settertobulte W Smith R Todd J . Health and Health Behaviour Among Young People in School-Aged Children: International Report from the HBSC 1997/1998 Survey. WHO Policy Series: Health Policy for Children and Adolescents, Issue 1. Copenhagen, Denmark: WHO Regional Office for Europe. World Health Organization Regional Office for Europe (2000).
57.
HBSC. HBSC Canada 1997/1998. Survey Data (1997). Available from: https://www.canada.ca/content/dam/phac-aspc/migration/phac-aspc/hp-ps/dca-dea/prog-ini/school-scolaire/behaviour-comportements/publications/pdf/hbsc97983gr_ef.pdf (Accessed June 8, 2022).
58.
Cassidy JD Carroll LJ Côté P . The Saskatchewan Health and Back Pain Survey. The Prevalence of Low Back Pain and Related Disability in Saskatchewan Adults. Spine (1998) 23(17):1860–6. 10.1097/00007632-199809010-00012
59.
Currie C Roberts C Morgan A Smith R Settertobulte W Samdal O et al Young People’s Health in Context: International Report from the HBSC 2001/2002 Survey. WHO Policy Series: Health Policy for Children and Adolescents, Issue 4. Copenhagen, Denmark: WHO Regional Office for Europe (2004).
60.
HBSC. Canada 2001/2002. Statistical Tables (2001). Available from: https://www.canada.ca/content/dam/phac-aspc/migration/phac-aspc/hp-ps/dca-dea/prog-ini/school-scolaire/behaviour-comportements/publications/pdf/hbsc_2001_2001.pdf (Accessed June 8, 2022).
61.
Currie SR Wang J . Chronic Back Pain and Major Depression in the General Canadian Population. PAIN (2004) 107(1):54–60. 10.1016/j.pain.2003.09.015
62.
Currie C Nic Gabhainn S Godeau E . Inequalities in Young People’s Health: International Report from the HBSC 2005/2006 Survey. WHO Policy Series: Health Policy for Children and Adolescents, Issue 5. Copenhagen, Denmark: WHO Regional Office for Europe (2008).
63.
Public Health Agency of Canada. Healthy Settings for Young People in Canada (2008). Available from: https://www.canada.ca/en/public-health/services/health-promotion/childhood-adolescence/publications/healthy-settings-young-people-canada.html (Accessed June 8, 2022).
64.
Currie C Zanotti C Morgan A . Social Determinants of Health and Well-Being Among Young People: International Report from the HBSC 2009/2010 Survey. WHO Policy Series: Health Policy for Children and Adolescents, Issue 6. Copenhagen, Denmark: WHO Regional Office for Europe (2012).
65.
Public Health Agency of Canada. The Health of Canada’s Young People: A Mental Health Focus (2012). Available from: https://www.canada.ca/en/public-health/services/health-promotion/childhood-adolescence/publications/health-canada-young-people-mental-health-focus.html (Accessed June 8, 2022).
66.
Ballina Garcia FJ Hernandez Mejía R Martín Lascuevas P Fernandez Santana J Cueto Espinar A . Epidemiology of Musculoskeletal Complaints and Use of Health Services in Asturias, Spain. Scand J Rheumatol (1994) 23(3):137–41. 10.3109/03009749409103046
67.
Sociedad Española de Reumatología. Estudio EPISER. Prevalencia e impacto de las enfermedades reumáticas en la población adulta española. Madrid: Sociedad Española de Reumatología (2006).
68.
Català E Reig E Artés M Aliaga L López JS Segú JL . Prevalence of Pain in the Spanish Population Telephone Survey in 5000 Homes. Eur J Pain (2002) 6(2):133–40. 10.1053/eujp.2001.0310
69.
Moreno Rodríguez MC Muñoz V Pérez P Sánchez Queija I . Los adolescentes españoles y su salud. Resumen del estudio “Health Behaviour in School Aged Children (HBSC-2002)”. (Colección “salud pública: promoción de la salud y epidemiología”). Madrid: Ministerio de Sanidad y Consumo (2005).
70.
World Health Organization. World Health Survey 2003. Geneva, Switzerland: World Health Organization (2003). Report of Spain.
71.
Moreno Rodríguez MC Munoz Tinoco MV Perez Moreno P Sánchez-Queija I Granado MC Ramos P et al Desarrollo adolescente y salud. Resultados del estudio HBSC-2006 con chicos y chicas españoles de 11 a 17 años. Madrid: Ministerio de Sanidad y Consumo (2008).
72.
Pinto-Meza A Serrano-Blanco A Codony M Reneses B von Korff M Maria Haro J et al Prevalence and Physical-Mental Comorbidity of Chronic Back and Neck Pain in Spain: Results from the ESEMeD Study. Med Clínica (2006) 127(9):325–30. 10.1157/13092313
73.
Demyttenaere K Bruffaerts R Lee S Posada-Villa J Kovess V Angermeyer MC et al Mental Disorders Among Persons with Chronic Back or Neck Pain: Results from the World Mental Health Surveys. Pain (2007) 129(3):332–42. 10.1016/j.pain.2007.01.022
74.
Alonso J Angermeyer MC Bernert S Bruffaerts R Brugha TS Bryson H et al Sampling and Methods of the European Study of the Epidemiology of Mental Disorders (ESEMeD) Project. Acta Psychiatr Scand Suppl (2004) 109(420):8–20. 10.1111/j.1600-0047.2004.00326
75.
Miró J Paredes S Rull M Queral R Miralles R Nieto R et al Pain in Older Adults: a Prevalence Study in the Mediterranean Region of Catalonia. Eur J Pain Lond Engl (2007) 11(1):83–92. 10.1016/j.ejpain.2006.01.001
76.
Moreno C Ramos P Rivera F Jiménez-Iglesias A García Moya I Sánchez-Queija I et al Las conductas relacionadas con la salud y el desarrollo de los adolescentes españoles. Resultados del estudio HBSC-2010 con chicos y chicas españoles de 11 a 18 años (2012). p. 920.
77.
Fernández-de-las-Peñas C Hernández-Barrera V Alonso-Blanco C Palacios-Ceña D Carrasco-Garrido P Jiménez-Sánchez S et al Prevalence of Neck and Low Back Pain in Community-Dwelling Adults in Spain: a Population-Based National Study. Spine (2011) 36(3):E213–9. 10.1097/BRS.0b013e3181d952c2
78.
Instituto Nacional de Estadística. Encuesta Nacional de Salud 2006. Metodología detallada. Madrid: Instituto Nacional de Estadística y Ministerio de Sanidad y Política Social (2007).
79.
Papacostas A . Eurobarometer 66.2: Nuclear Energy and Safety, and Public Health Issues. In: ICPSR21460-v2. GESIS/Ann Arbor, MI, Germany: Inter-university Consortium for Political and Social Research Cologne. (2006).
80.
Papacostas A . Eurobarometer 66.2: Nuclear Energy and Safety, and Public Health Issues. Codebook. In: ICPSR21460-v2. GESIS/Ann Arbor, MI, Germany: Inter-university Consortium for Political and Social Research Cologne. (2006).
81.
Laso Á R Ramasco Gutiérrez M Cruz Maceín JL Rodríguez Rieiro C Garabato González S Aerny Perreten N . Informe sobre desigualdades en salud a partir de la Encuesta Regional de Salud de Madrid 2007. Madrid, Spain: Consejería de Sanidad de la Comunidad de Madrid (2010).
82.
Rodríguez-Oviedo P Ruano-Ravina A Pérez-Ríos M García FB Gómez-Fernández D Fernández-Alonso A et al School Children’s Backpacks, Back Pain and Back Pathologies. Arch Dis Child (2012) 97(8):730–2. 10.1136/archdischild-2011-301253
83.
Vargas-Prada S Serra C Martínez JM Ntani G Delclos GL Palmer KT et al Psychological and Culturally-Influenced Risk Factors for the Incidence and Persistence of Low Back Pain and Associated Disability in Spanish Workers: Findings from the CUPID Study. Occup Environ Med (2013) 70(1):57–62. 10.1136/oemed-2011-100637
84.
Mesas AE González AD Mesas CE de Andrade SM Magro IS del Llano J . The Association of Chronic Neck Pain, Low Back Pain, and Migraine with Absenteeism Due to Health Problems in Spanish Workers. Spine (2014) 39(15):1243–53. 10.1097/BRS.0000000000000387
85.
Instituto Nacional de Estadística. Encuesta Nacional de Salud. Evaluación de la falta de respuesta en la Encuesta Nacional de Salud 2009; 2010. Madrid, Spain: Ministerio de Sanidad (2009).
86.
Koyanagi A Stickley A Garin N Miret M Ayuso-Mateos JL Leonardi M et al The Association between Obesity and Back Pain in Nine Countries: a Cross-Sectional Study. BMC Public Health (2015) 15:123. 10.1186/s12889-015-1362-9
87.
Lara E Miret M Olaya B Caballero FF Morillo D Moneta MV et al Cohort Profile: The Spanish Longitudinal Study on Ageing and Health (Edad Con Salud). Int J Epidemiol (2022) 51:e189–e199. 10.1093/ije/dyac118
88.
Balagué F Nordin M Skovron ML Dutoit G Yee A Waldburger M . Non-specific Low-Back Pain Among Schoolchildren: a Field Survey with Analysis of Some Associated Factors. J Spinal Disord (1994) 7(5):374–9.
89.
Tillmann R Voorpostel M Antal E Dasoki N Klaas H Kuhn U et al The Swiss Household Panel (SHP). Jahrb Für Natl Stat (2021) 242(3):403–20. 10.1515/jbnst-2021-0039
90.
Voorpostel M Tillmann R Lebert F Kuhn U Lipps O Ryser VA et al Swiss Household Panel User Guide (1999 - 2016). Lausanne: FORS (2017).
91.
Santos-Eggimann B Wietlisbach V Rickenbach M Paccaud F Gutzwiller F . One-year Prevalence of Low Back Pain in Two Swiss Regions: Estimates from the Population Participating in the 1992-1993 MONICA Project. Spine (2000) 25(19):2473–9. 10.1097/00007632-200010010-00009
92.
Ambord S Eichenberger Y Delgrande Jordan M . Gesundheit und Wohlbefinden der 11- bis 15-jährigen Jugendlichen in der Schweiz im Jahr 2018 und zeitliche Entwicklung - Resultate der Studie “Health Behaviour in School-aged Children” (HBSC) (Forschungsbericht Nr 113). Lausanne: Sucht Schweiz, Addiction Suisse (2020).
93.
Delgrande Jordan M Annaheim B . Habitudes alimentaires, activité physique et statut pondéral chez les élèves de 11 à 15 ans en Suisse. Situation en 2006 et évolution récente - Résultats de l’Enquête internationale Health Behaviour in School-aged Children (HBSC). Lausanne: Institut suisse de prévention de l’alcoolisme et autres toxicomanies (2009).
94.
Windlin B Delgrande Jordan M . Multipler Substanzkonsum - Systematische Zusammenstellung von Prävalenzen bei 11- bis 15-jährigen Jugendlichen in der Schweiz. In: Resultate der internationalen Studie «Health Behaviour in School-aged Children» (HBSC) 2010 (Forschungsbericht Nr 66). Lausanne: Sucht Schweiz (2013).
95.
Erne C Elfering A . Low Back Pain at School: Unique Risk Deriving from Unsatisfactory Grade in Maths and School-type Recommendation. Eur Spine J (2011) 20(12):2126–33. 10.1007/s00586-011-1803-9
96.
Kolb E Canjuga M Bauer GF Läubli T . Course of Back Pain across 5 Years: a Retrospective Cohort Study in the General Population of Switzerland. Spine (2011) 36(4):E268–73. 10.1097/BRS.0b013e3181f324b5
97.
Genebra CVDS Maciel NM Bento TPF Simeão SFAP Vitta AD . Prevalence and Factors Associated with Neck Pain: a Population-Based Study. Braz J Phys Ther (2017) 21(4):274–80. 10.1016/j.bjpt.2017.05.005
98.
Plotnikoff R Karunamuni N Lytvyak E Penfold C Schopflocher D Imayama I et al Osteoarthritis Prevalence and Modifiable Factors: a Population Study. BMC Public Health (2015) 15:1195. 10.1186/s12889-015-2529-0
99.
Raine KD Plotnikoff R Schopflocher D Lytvyak E Nykiforuk CIJ Storey K et al Healthy Alberta Communities: Impact of a Three-Year Community-Based Obesity and Chronic Disease Prevention Intervention. Prev Med (2013) 57(6):955–62. 10.1016/j.ypmed.2013.08.024
100.
Fernandez-Lopez JC Laffon A Blanco FJ Carmona L EPISER Study Group. Prevalence, Risk Factors, and Impact of Knee Pain Suggesting Osteoarthritis in Spain. Clin Exp Rheumatol (2008) 26(2):324–32.
101.
Dionne CE Dunn KM Croft PR Nachemson AL Buchbinder R Walker BF et al A Consensus Approach toward the Standardization of Back Pain Definitions for Use in Prevalence Studies. Spine (2008) 33(1):95–103. 10.1097/BRS.0b013e31815e7f94
102.
Maher CG Ferreira G . Iran’s burden of Disease and burden of Data Collection. Lancet (2022) 400(10351):490. 10.1016/s0140-6736(22)01335-6
103.
Farzadfar F Naghavi M Sepanlou SG Moghaddam SS Dangel WJ Weaver ND et al Health System Performance in Iran: a Systematic Analysis for the Global Burden of Disease Study 2019. Lancet (2022) 399(10335):1625–45. 10.1016/S0140-6736(21)02751-3
104.
Stevens GA Alkema L Black RE Boerma JT Collins GS Ezzati M et al Guidelines for Accurate and Transparent Health Estimates Reporting: the GATHER Statement. Lancet (2016) 388(10062):e19–23. 10.1016/S0140-6736(16)30388-9
105.
Brhlikova P Pollock AM Manners R . Global Burden of Disease Estimates of Depression – How Reliable Is the Epidemiological Evidence?J R Soc Med (2011) 104(1):25–34. 10.1258/jrsm.2010.100080
106.
Wyper GMA Fletcher E Grant I Harding O Moro MTH McCartney G et al Widening of Inequalities in COVID-19 Years of Life Lost from 2020 to 2021: a Scottish Burden of Disease Study. J Epidemiol Community Health (2022) 76(8):746–9. 10.1136/jech-2022-219090
107.
Mathers CD Stevenson CE Vos ET Begg SJ . The Australian Burden of Disease Study: Measuring the Loss of Health from Diseases, Injuries and Risk Factors. Med J Aust (2000) 172(12):592–6. 10.5694/j.1326-5377.2000.tb124125.x
108.
Liu S Wang B Fan S Wang Y Zhan Y Ye D . Global burden of Musculoskeletal Disorders and Attributable Factors in 204 Countries and Territories: a Secondary Analysis of the Global Burden of Disease 2019 Study. BMJ Open (2022) 12(6):e062183. 10.1136/bmjopen-2022-062183
101.
de Luca K Briggs AM French SD Ferreira ML Cross M Blyth F et al Disability burden Due to Musculoskeletal Conditions and Low Back Pain in Australia: Findings from GBD 2019. Chiropr Man Ther (2022) 30:22. 10.1186/s12998-022-00434-4
110.
Hoy DG Smith E Cross M Sanchez-Riera L Buchbinder R Blyth FM et al The Global burden of Musculoskeletal Conditions for 2010: an Overview of Methods. Ann Rheum Dis (2014) 73(6):982–9. 10.1136/annrheumdis-2013-204344
111.
Wyper GMA Grant I Fletcher E McCartney G Stockton DL . The Impact of Worldwide, National and Sub-national Severity Distributions in Burden of Disease Studies: A Case Study of Cancers in Scotland. PLOS ONE (2019) 14(8):e0221026. 10.1371/journal.pone.0221026
112.
Emmons-Bell S Johnson C Boon-Dooley A Corris PA Leary PJ Rich S et al Prevalence, Incidence, and Survival of Pulmonary Arterial Hypertension: A Systematic Review for the Global burden of Disease 2020 Study. Pulm Circ (2022) 12(1):e12020. 10.1002/pul2.12020
113.
Merino J Caballero I Rivas B Serrano M Piattini M . A Data Quality in Use Model for Big Data. Future Gener Comput Syst (2016) 63:123–30. 10.1016/j.future.2015.11.024
114.
Wyper GMA Assuncao R Fletcher E Gourley M Grant I Haagsma JA et al The Increasing Significance of Disease Severity in a burden of Disease Framework. Scand J Public Health (2021) 51:296–300. 10.1177/14034948211024478
115.
Devleesschauwer B . European burden of Disease Network: Strengthening the Collaboration. Eur J Public Health (2020) 30(1):2–3. 10.1093/eurpub/ckz225
116.
Lopez AD Mathers CD Ezzat M Jamison DT Murray CJ . Global Burden of Disease and Risk Factors. Washington (DC): World Bank (2006).
117.
Briggs AM Jordan JE Kopansky-Giles D Sharma S March L Schneider CH et al The Need for Adaptable Global Guidance in Health Systems Strengthening for Musculoskeletal Health: a Qualitative Study of International Key Informants. Glob Health Res Pol (2021) 6(1):24. 10.1186/s41256-021-00201-7
Summary
Keywords
global burden of disease, epidemiology, prevalence, musculoskeletal disorders, low back pain, neck pain, knee osteoarthritis, GRADE approach
Citation
Muñoz Laguna J, Puhan MA, Rodríguez Artalejo F, De Pauw R, Wyper GMA, Devleesschauwer B, Santos JV and Hincapié CA (2023) Certainty of the Global Burden of Disease 2019 Modelled Prevalence Estimates for Musculoskeletal Conditions: A Meta-Epidemiological Study. Int J Public Health 68:1605763. doi: 10.3389/ijph.2023.1605763
Received
09 January 2023
Accepted
27 April 2023
Published
31 May 2023
Volume
68 - 2023
Edited by
Paolo Chiodini, University of Campania Luigi Vanvitelli, Italy
Reviewed by
William Dab, Conservatoire National des Arts et Métiers (CNAM), France
Updates
Copyright
© 2023 Muñoz Laguna, Puhan, Rodríguez Artalejo, De Pauw, Wyper, Devleesschauwer, Santos and Hincapié.
This is an open-access article distributed under the terms of the Creative Commons Attribution License (CC BY). The use, distribution or reproduction in other forums is permitted, provided the original author(s) and the copyright owner(s) are credited and that the original publication in this journal is cited, in accordance with accepted academic practice. No use, distribution or reproduction is permitted which does not comply with these terms.
*Correspondence: Cesar A. Hincapié, cesar.hincapie@uzh.ch
Disclaimer
All claims expressed in this article are solely those of the authors and do not necessarily represent those of their affiliated organizations, or those of the publisher, the editors and the reviewers. Any product that may be evaluated in this article or claim that may be made by its manufacturer is not guaranteed or endorsed by the publisher.